 ZH
ZH  EN
EN  FR
FR  ES
ES  KO
KO  PT
PT  AR
AR  FA
FA  RU
RU  NL
NL  MS
MS  VI
VI  PH
PH  TH
TH  ID
ID 

Market’s hopes for US-Iran diplomacy are enhanced as recent developments suggest a potential pathway toward de-escalation, with reports indicating that a preliminary understanding may help restart negotiations over Iran’s nuclear program and extend the ceasefire framework.
This improvement in geopolitical sentiment has reduced demand for traditional safe-haven assets, contributing to a softer USD performance in the FX market, while simultaneously supporting gold prices and adding downward pressure on crude oil as risk premiums ease across energy markets.
USD edges lower as safe haven status weighs
The USD edged lower against its counterparts yesterday in the FX market as the market’s hopes for a diplomatic resolution of the US-Iran conflict. Despite the two sides exchanging air strikes, a memo of understanding seems to have been reached which could allow the negotiations for Iran’s nuclear program to restart and prolong the ceasefire for another 60 days. The USD’s safe-haven status tended to weigh on its price while at the same time allowed gold’s price to edge higher. Furthermore, the enhancement of the market’s hopes allowed oil prices to continue to drop.
Germany’s and France’s HICP rates to shake the EUR
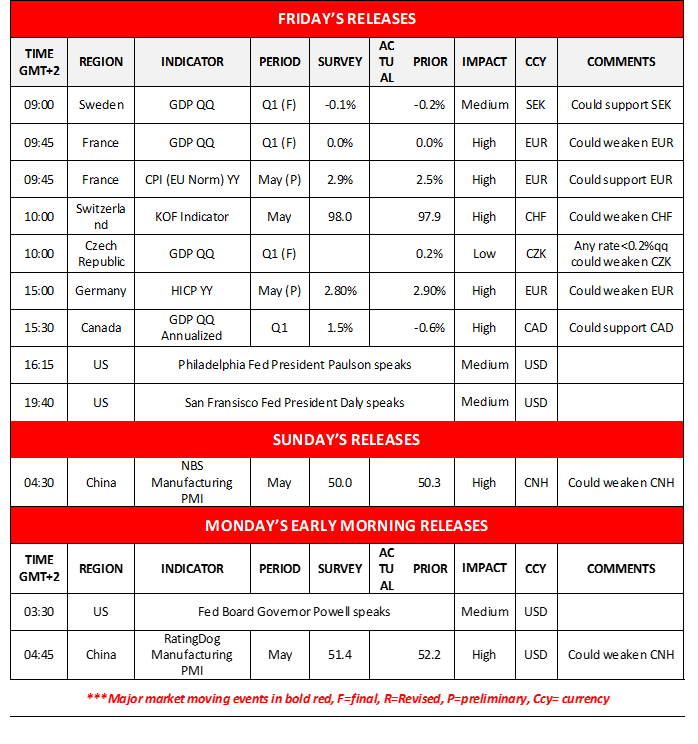
EUR traders on the other hand are expected to keep a close eye on the release of France’s and Germany’s preliminary HICP rates for May. Should the rates accelerate, possibly beyond market expectations, we may see the ECB facing even more pressure to hike rates in its June meeting and thus could support the EUR.
Canada’s GDP rates to move the Loonie
The Loonie gained against the USD in a surprise move yesterday, mostly due to the weakening of the USD rather than the strengthening of the CAD. BoC Governor Macklem highlighted a solid financial system yesterday, yet at the same time warned that vulnerabilities have grown. Today we highlight for Loonie traders the release of Canada’s GDP rate and a possible acceleration of the rate could support the Loonie.
Mixed signals from US stock markets
We note some mixed signals from US stock markets as Nasdaq and S&P 500 were on the rise, yet Dow Jones edged lower. The market’s hopes for a possible understanding between the US and Iran allowed for the market sentiment to improve. Further improvement of the market sentiment could support US equities.
今日其他经济亮点
Today we get the final GDP rates of Sweden, France, the Czech Republic and Switzerland’s KOF indicator for May. On a monetary level, we note that the Fed’s Paulson and Daly speak. On Sunday, we get China’s NBS PMI figures for May and on Monday we get China’s Rating Dog manufacturing PMI figure for May while US Fed Board Governor Powell speaks.
Charts to keep an eye out
EUR/USD
EUR/USD remained in a sideways motion over the past days, within the corridor formed by the 1.1665 (R1) resistance line and the 1.1575 (S1) support level.
We intend to maintain a bias for a sideways motion of the pair as long as the pair’s price action respects the prementioned levels. We also note that the RSI indicator runs along the reading of 50, which may allow the sideways motion to continue.
Should the bulls get control over the pair, we may see EUR/USD breaking the 1.1665 (R1) resistance line and start aiming for the 1.1825 (R2) resistance level. Should the bears take over, we may see EUR/USD breaking the 1.1575 (S1) support line and set in its sights the 1.1410 (S2) support level.
WTI
WTI’s price continued to drop aiming for the 87.10 (S1) support line. We maintain a bearish outlook for WTI’s price and intend to keep it as long as the downward trendline continues to guide it.
We note that the RSI indicator has dropped even further nearing the reading of 30, implying an intensifying bearish market sentiment for WTI’s price. Should the bears remain in charge, we may see WTI’s price breaking the 87.10 (S1) support line, thus opening the gates for the 82.00 (S2) support base.
Should the bulls take over, we may see WTI’s price action reversing yesterday’s losses, breaking the prementioned downward trendline in a first signal that the downward motion has been interrupted and continue higher to break also the 93.80 (R1) resistance line and start advancing towards the 100.90 (R2) resistance level. Calendar follows
欧元/美元日线图
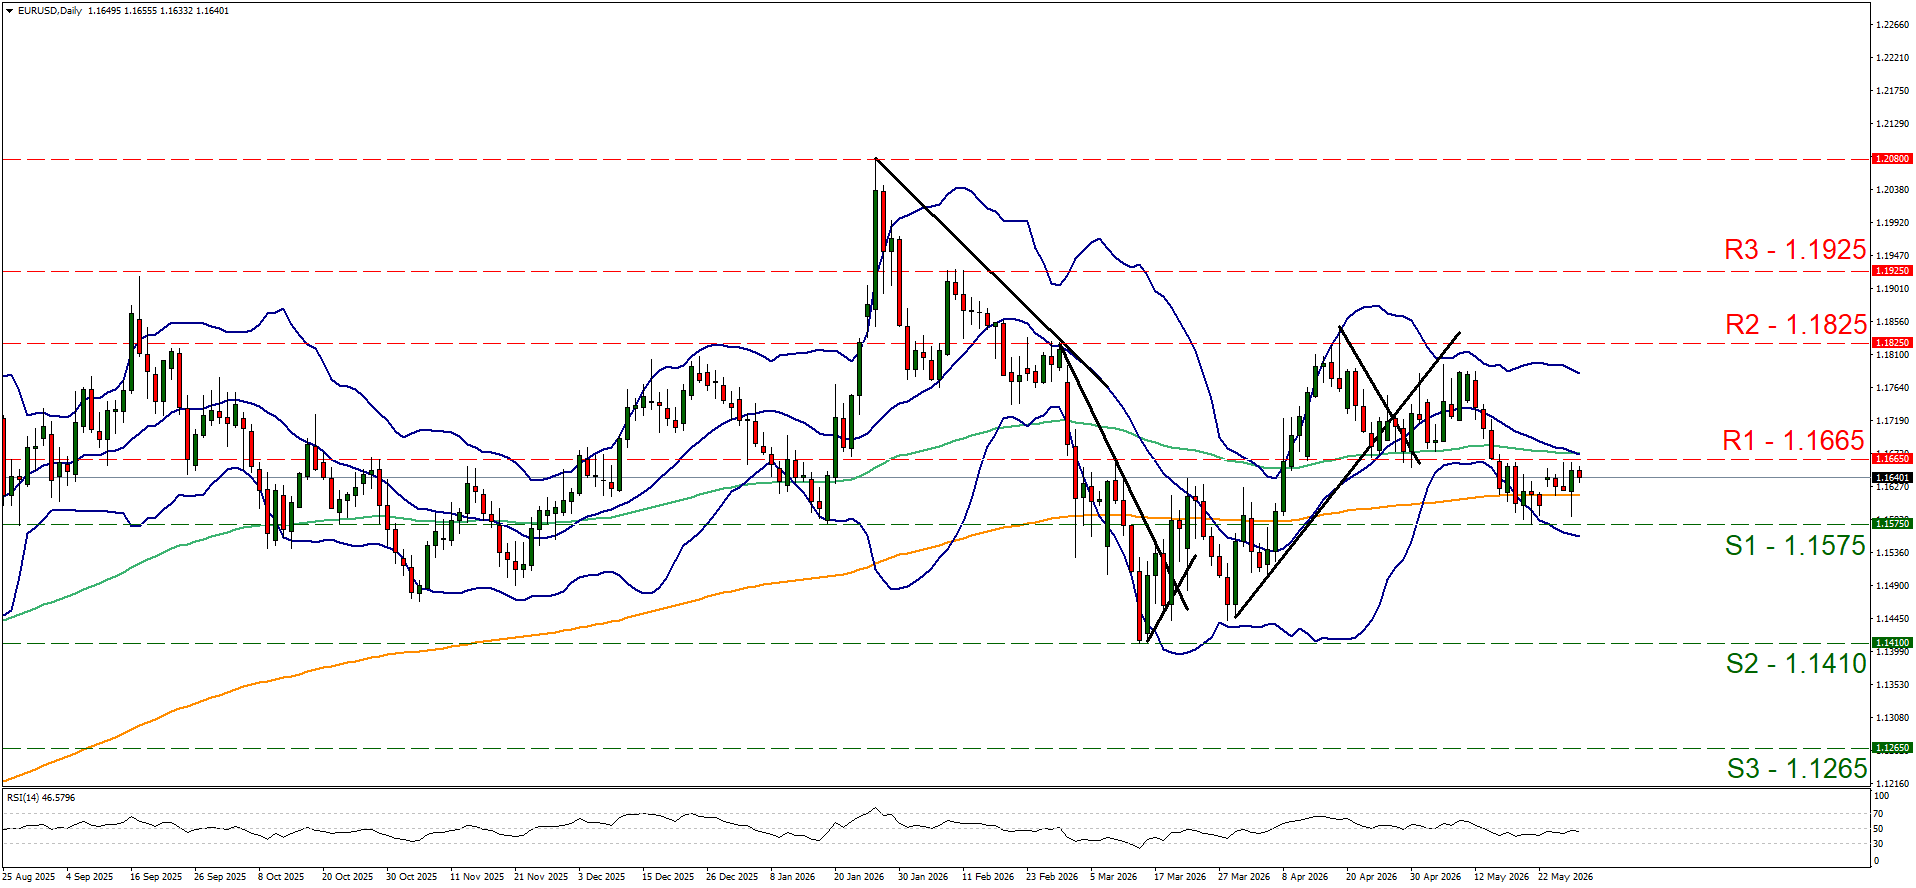
- Support: 1.1575 (S1), 1.1410 (S2), 1.1265 (S3)
- Resistance: 1.1665 (R1), 1.1825 (R2), 1.1925 (R3)
WTI Daily Chart
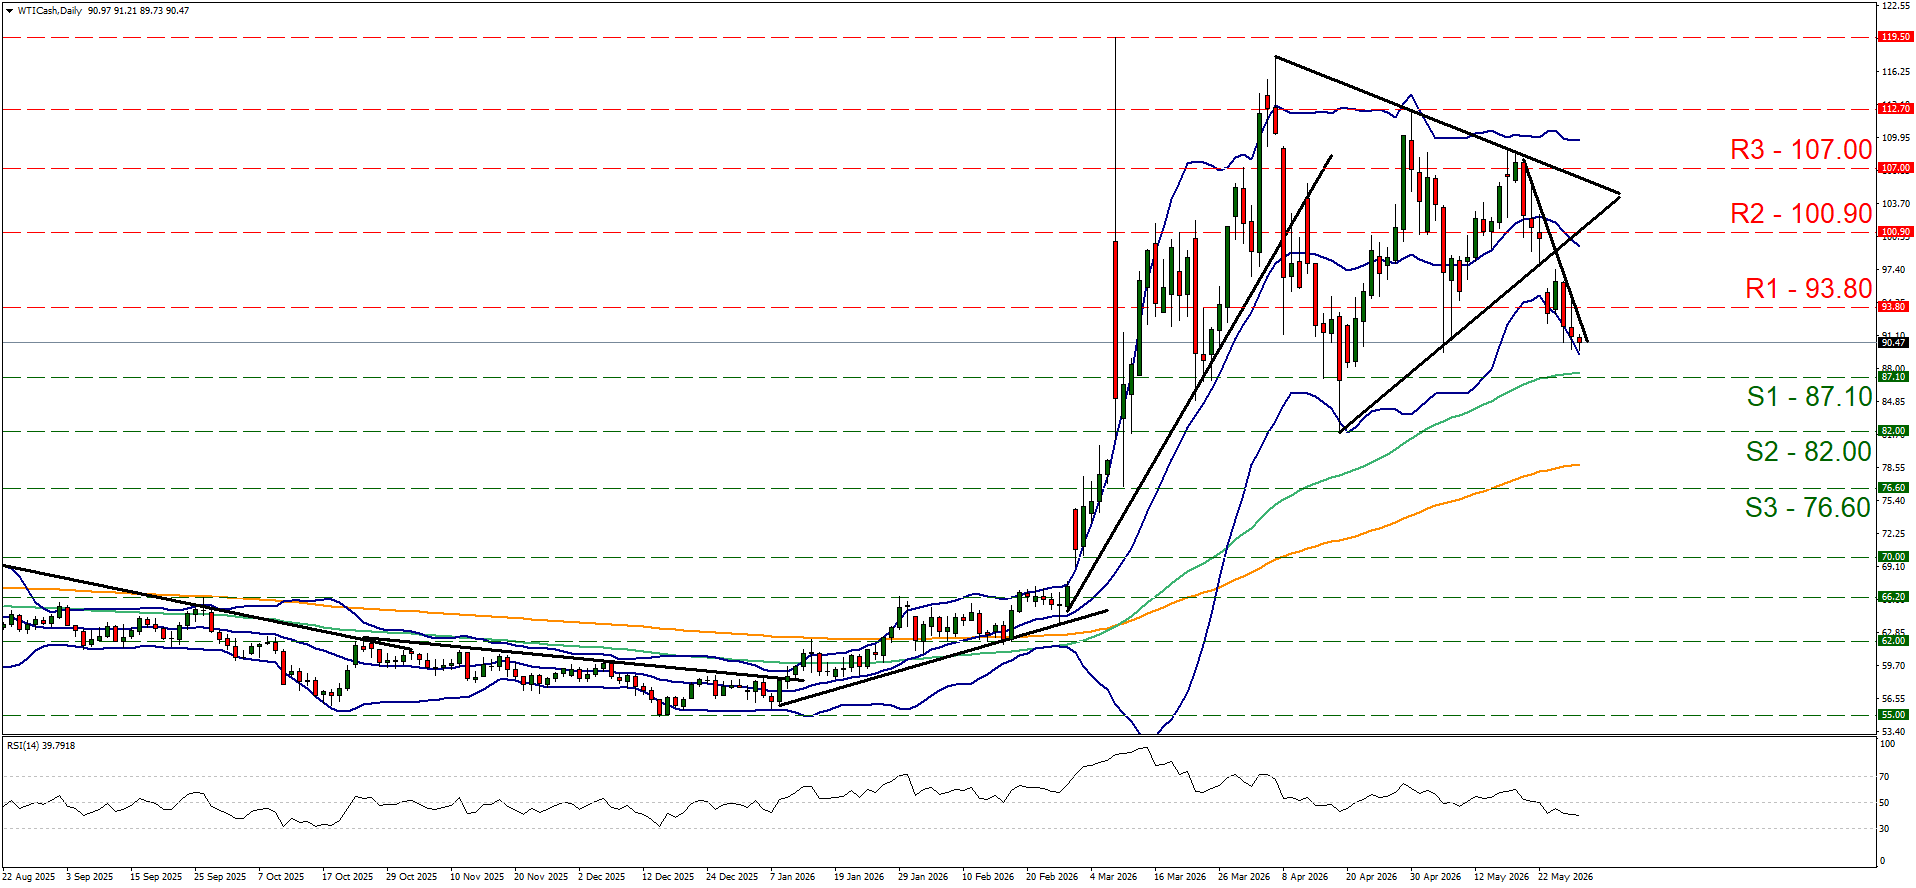
- Support: 87.10 (S1), 82.00 (S2), 76.60 (S3)
- Resistance: 93.80 (R1), 100.90 (R2), 107.00 (R3)
免责声明:
本信息不被视为投资建议或投资推荐, 而是一种营销传播. IronFX 对本信息中引用或超链接的第三方提供的任何数据或信息概不负责.


