
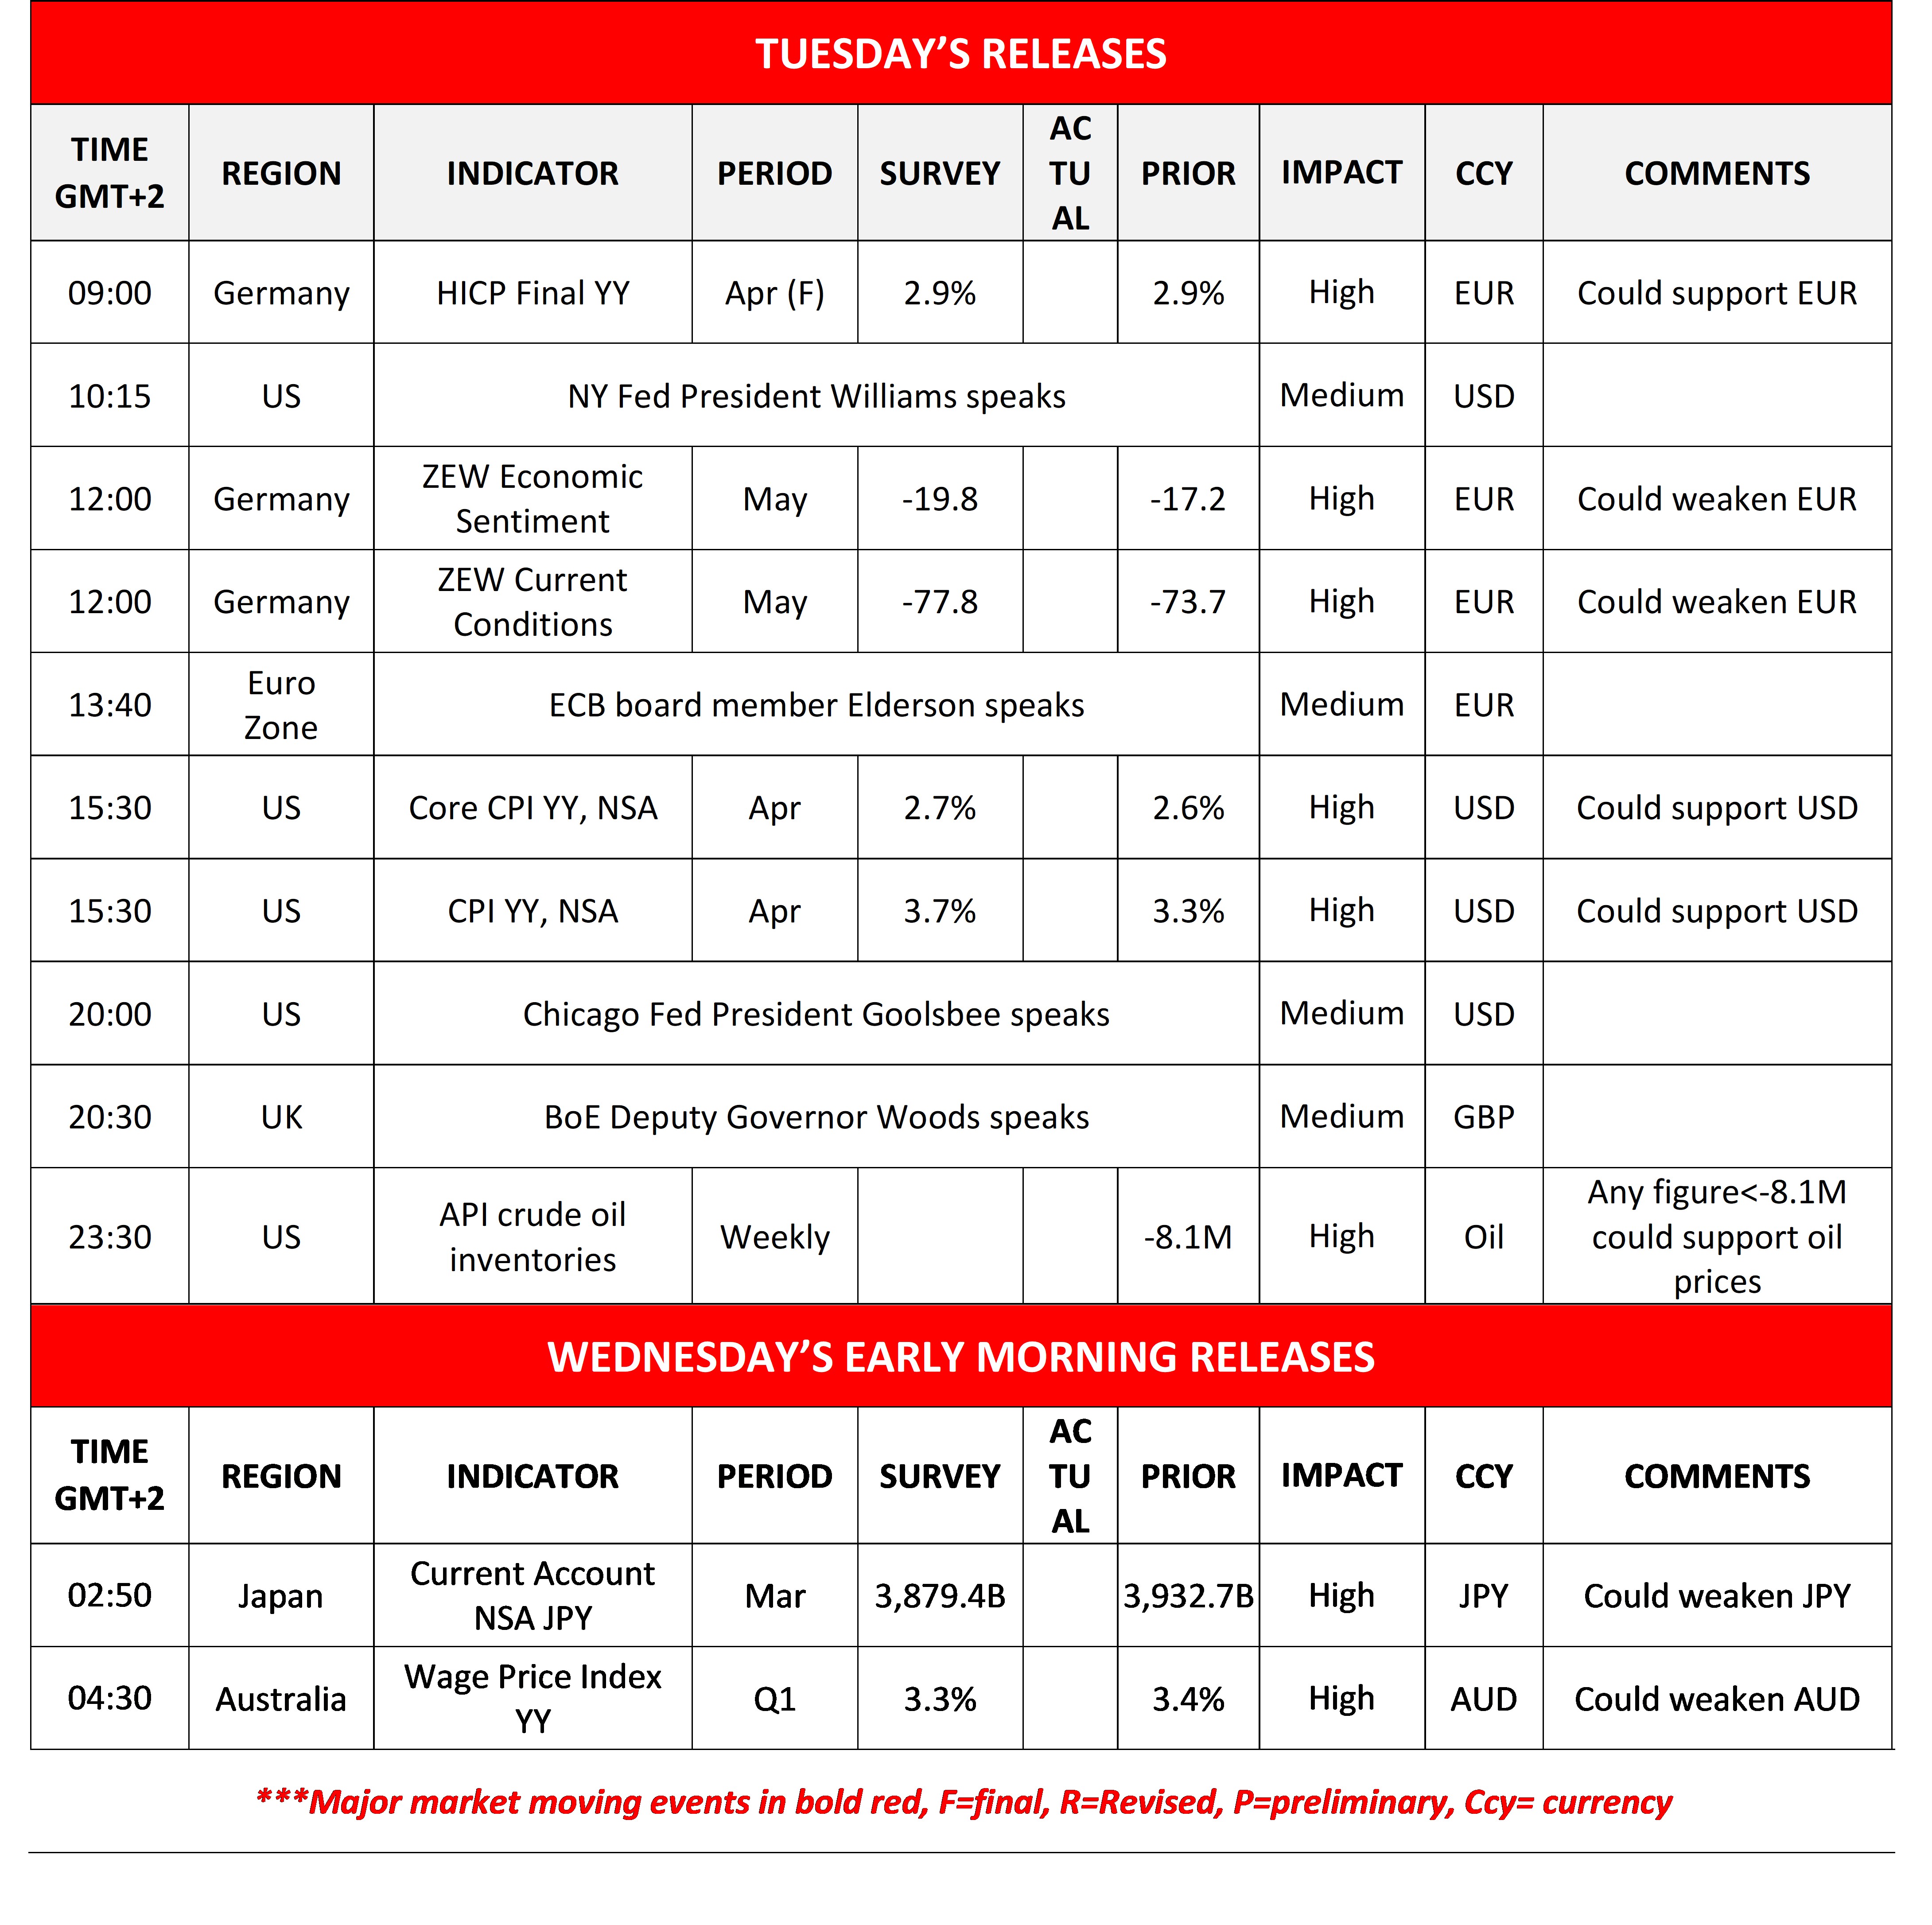
Market focus on US CPI rates for April remains strong as investors await a key inflation update that could shape expectations for US monetary policy.
The USD stays supported amid rising geopolitical uncertainty and fading hopes for a diplomatic breakthrough, while US equities show signs of a corrective pullback.
Meanwhile, oil prices are climbing on renewed supply-side concerns, with gold and Bitcoin holding relatively steady ahead of today’s high-impact CPI release.
USD remains supported in the FX market
The USD remained supported in the FX market as hopes for a possible diplomatic solution to the US conflict are fading away. Practically the USD continues to gain safe haven inflows.
Today we highlight the release of the US CPI rates for April and a possible wider than expected acceleration of the rates could provide additional support for the USD.
Also in the FX market we highlight the weakening of the GBP across the board , as UK politics seem to enhance uncertainty, as noted in yesterday’s report.
US stock markets seem to correct lower
US stock market indexes seem to be correcting lower in today’s Asian session, which may have been somewhat expected. Nevertheless, we continue to view the market’s expectations for AI technology as key for their direction and a possible improvement of the market sentiment may allow US equities to be in the greens again.
We also highlight the release of the US CPI rates for April and a possible wider-than-expected acceleration of the rates could weigh on US equities.
Oil prices on the rise
As was expected, the fall through of the US-Iranian negotiations, enhanced market worries for a possible prolongment of the conflict with negative implication for the supply side of the international oil market. Should we see the market worries being further enhanced, we may see oil prices rising further.
Gold remains stable
Gold remained relatively stable despite edging lower. We still view the negative correlation between gold and the USD as being active, hence any further strengthening of the USD could enhance bearish tendencies for the precious metal.
Also we highlight the release of the US CPI rates for April as a possible market mover for gold’s price and a possible substantial acceleration of the rates could weigh on gold’s price
Bitcoin also remains stable
Also Bitcoin remained relatively stable with no major news seemingly affecting it at the current stage. Should we see the market sentiment turning more cautious we may see Bitcoin’s price losing ground.
今日其他经济亮点
Today we get Germany’s final HICP rates for April, the ZEW indicators for May and later on we get the US API weekly crude oil inventories figure.
In tomorrow’s Asian session we note the release of Japan’s current account balance for March and Australia’s wage price index for Q1.
Charts to keep an eye out
USD/JPY
USD/JPY edged higher in today’s Asian session, teasing the 157.60 (R1) resistance line. For the time being we maintain a bias for a sideways motion of the pair to continue, given also that the RSI indicator remains just below the reading of 50.
For a bullish outlook to emerge, we would require USD/JPY’s price to break clearly the 157.60 (R1) resistance line and start aiming for the 159.85 (R2) resistance level.
Should the bears take over, we may see USD/JPY reversing course and reaching if not breaking the 154.30 (S1) support line.
WTI
WTI‘s price rose in today’s Asian session, taking another swing at the 100.90 (R1) resistance line. The failure of the commodity’s price to clearly break the R1, denies it a bullish outlook at the current stage, thus we maintain our bias for the commodity’s price action to maintain a sideways motion.
The RSI indicator has slightly surpassed the reading of 50, yet remains unconvincing currently for a possible bullish outlook of the WTI’s price action. Should the bears take the driver’s seat, we may see WTI’s price breaking the 93.80 (S1) support line and start aiming for the 87.10 (S2) support level.
Should the bulls take over we may see WTI’s price breaking the 100.90 (R1) resistance line and start aiming for the 107.00 (R2) level.
USD/JPY Daily Chart
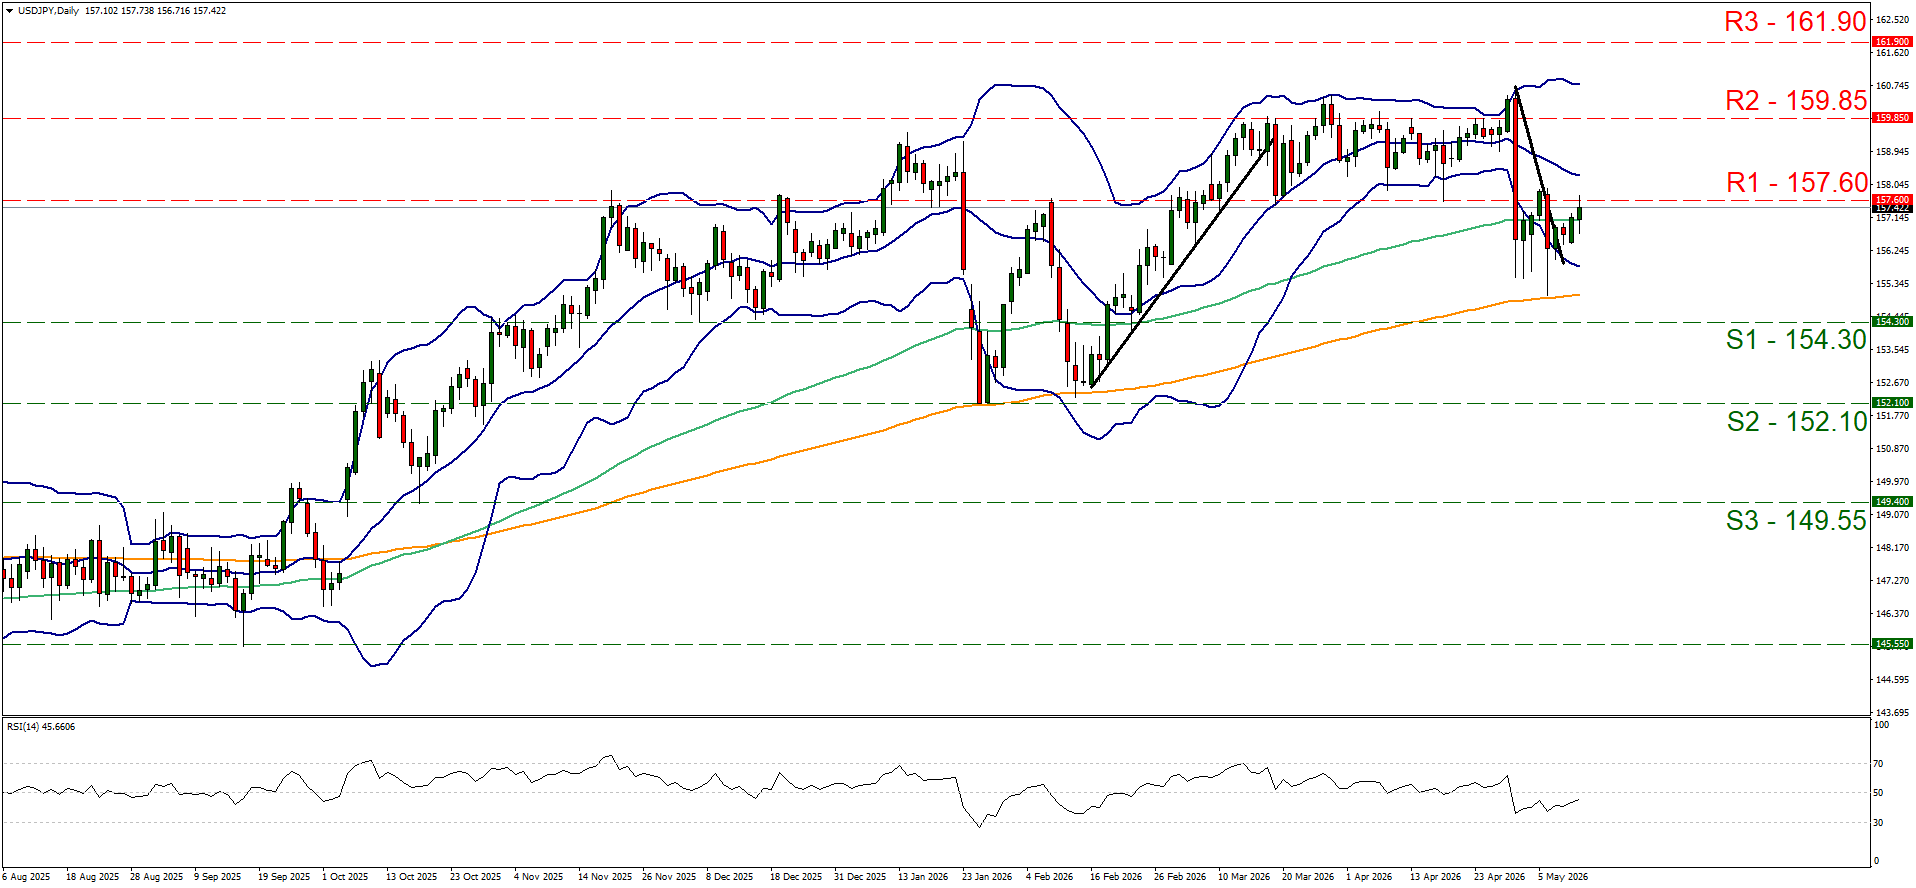
- Support: 157.60 (S1), 152.10 (S2), 149.55 (S3)
- Resistance: 157.60 (R1), 159.85 (R2), 161.90 (R3)
WTI Daily Chart
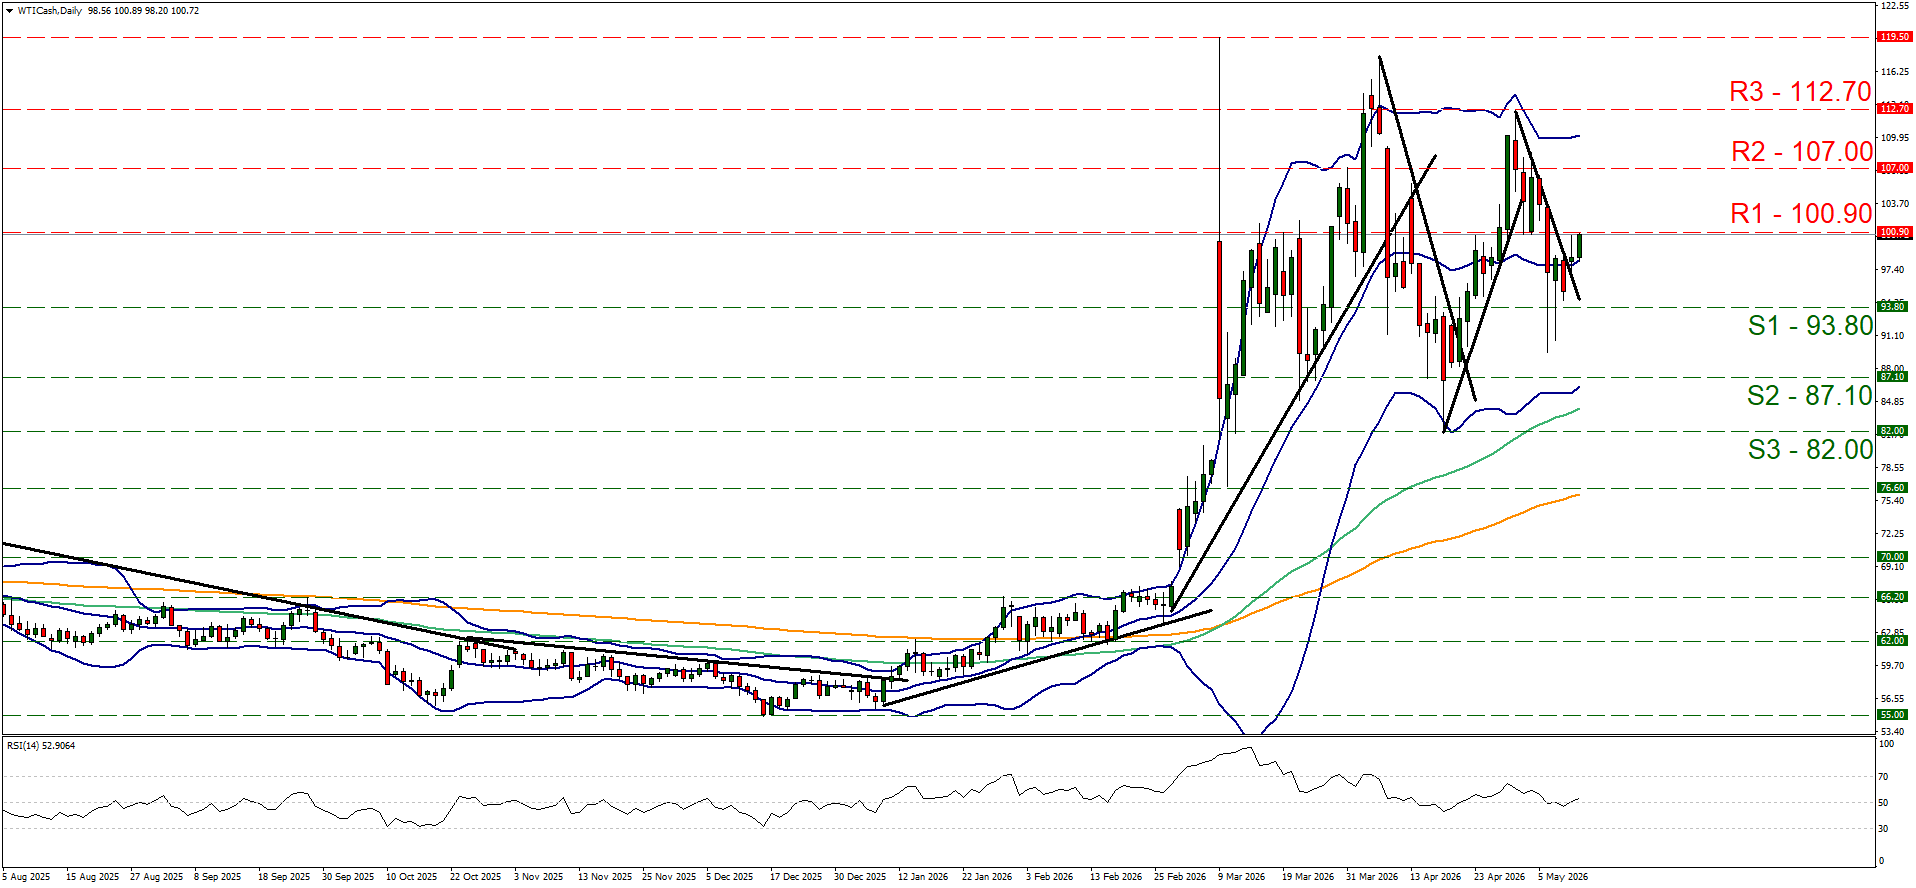
- Support: 93.80 (S1), 87.10 (S2), 82.00 (S3)
- Resistance: 100.90 (R1), 107.00 (R2), 112.70 (R3)
免责声明:
本信息不被视为投资建议或投资推荐, 而是一种营销传播. IronFX 对本信息中引用或超链接的第三方提供的任何数据或信息概不负责.