 PT
PT  EN
EN  FR
FR  ES
ES  KO
KO  ZH
ZH  AR
AR  FA
FA  RU
RU  NL
NL  MS
MS  VI
VI  PH
PH  TH
TH  ID
ID 

USD gains on safe-haven inflows
The USD gained in the FX market fuelled on a fundamental level by worries about inflation, the escalation of the war in the Middle East and Trump’s efforts to restart the trade war with tariffs. The EUR continued to lose ground as the ECB remained on hold and its forward guidance was not as hawkish as may have been expected. Today, the release of Eurozone’s preliminary PMI figures for July may prove to be a market mover for the EUR. We also worry for USD/JPY, as the USD reached new 40-year high levels against the JPY and the risk of a market intervention by Japanese Authorities to the Yen’s rescue has increased substantially.
US stock markets edge lower
Major Wall Street indexes edged lower yesterday as earnings reports released tended to enhance worries for AI spending, while at the same time rising oil prices stoked worries for a tighter monetary policy by the Fed. We expect fundamentals to lead US equity markets today, yet also note the release of the earnings reports of Exxon Mobil, American Express and Verizon.
Oil prices dip in anticipation of negotiations
Oil prices dipped lower yesterday and during today’s Asian session as they remain caught in conflicting fundamentals. On the one hand the ongoing US-Iran strikes and the threat of Yemen’s Houthis applying a naval blockade on Saudi Arabia, enhance market worries and lift oil prices, yet on the other, intensifying mediation for a restart of the US-Iran negotiations weigh on oil prices.
Oil prices surge on Middle East conflict
Oil prices surged yesterday as the US –Iran war is threatening to become once again a regional war. Iranian-backed Houthis have hit two Saudi Arabian vessels in the Red Sea, under the pretext of a naval blockade. US President Trump has threatened with intense and imminent military action against Iran and the Houthis, while at the same time the prospect of a restart of the US-Iranian negotiations becoming weaker.
Gold’s price loses ground
Gold’s price dropped yesterday and during today’s Asian session, as the escalation of the US-Iran conflict drove oil prices higher and thus worries for inflationary pressures and a tighter monetary policy by the Fed intensified. We still view the negative correlation of the USD with gold’s price as active and any rise of the greenback could weigh further on gold’s price.
Other highlights for today
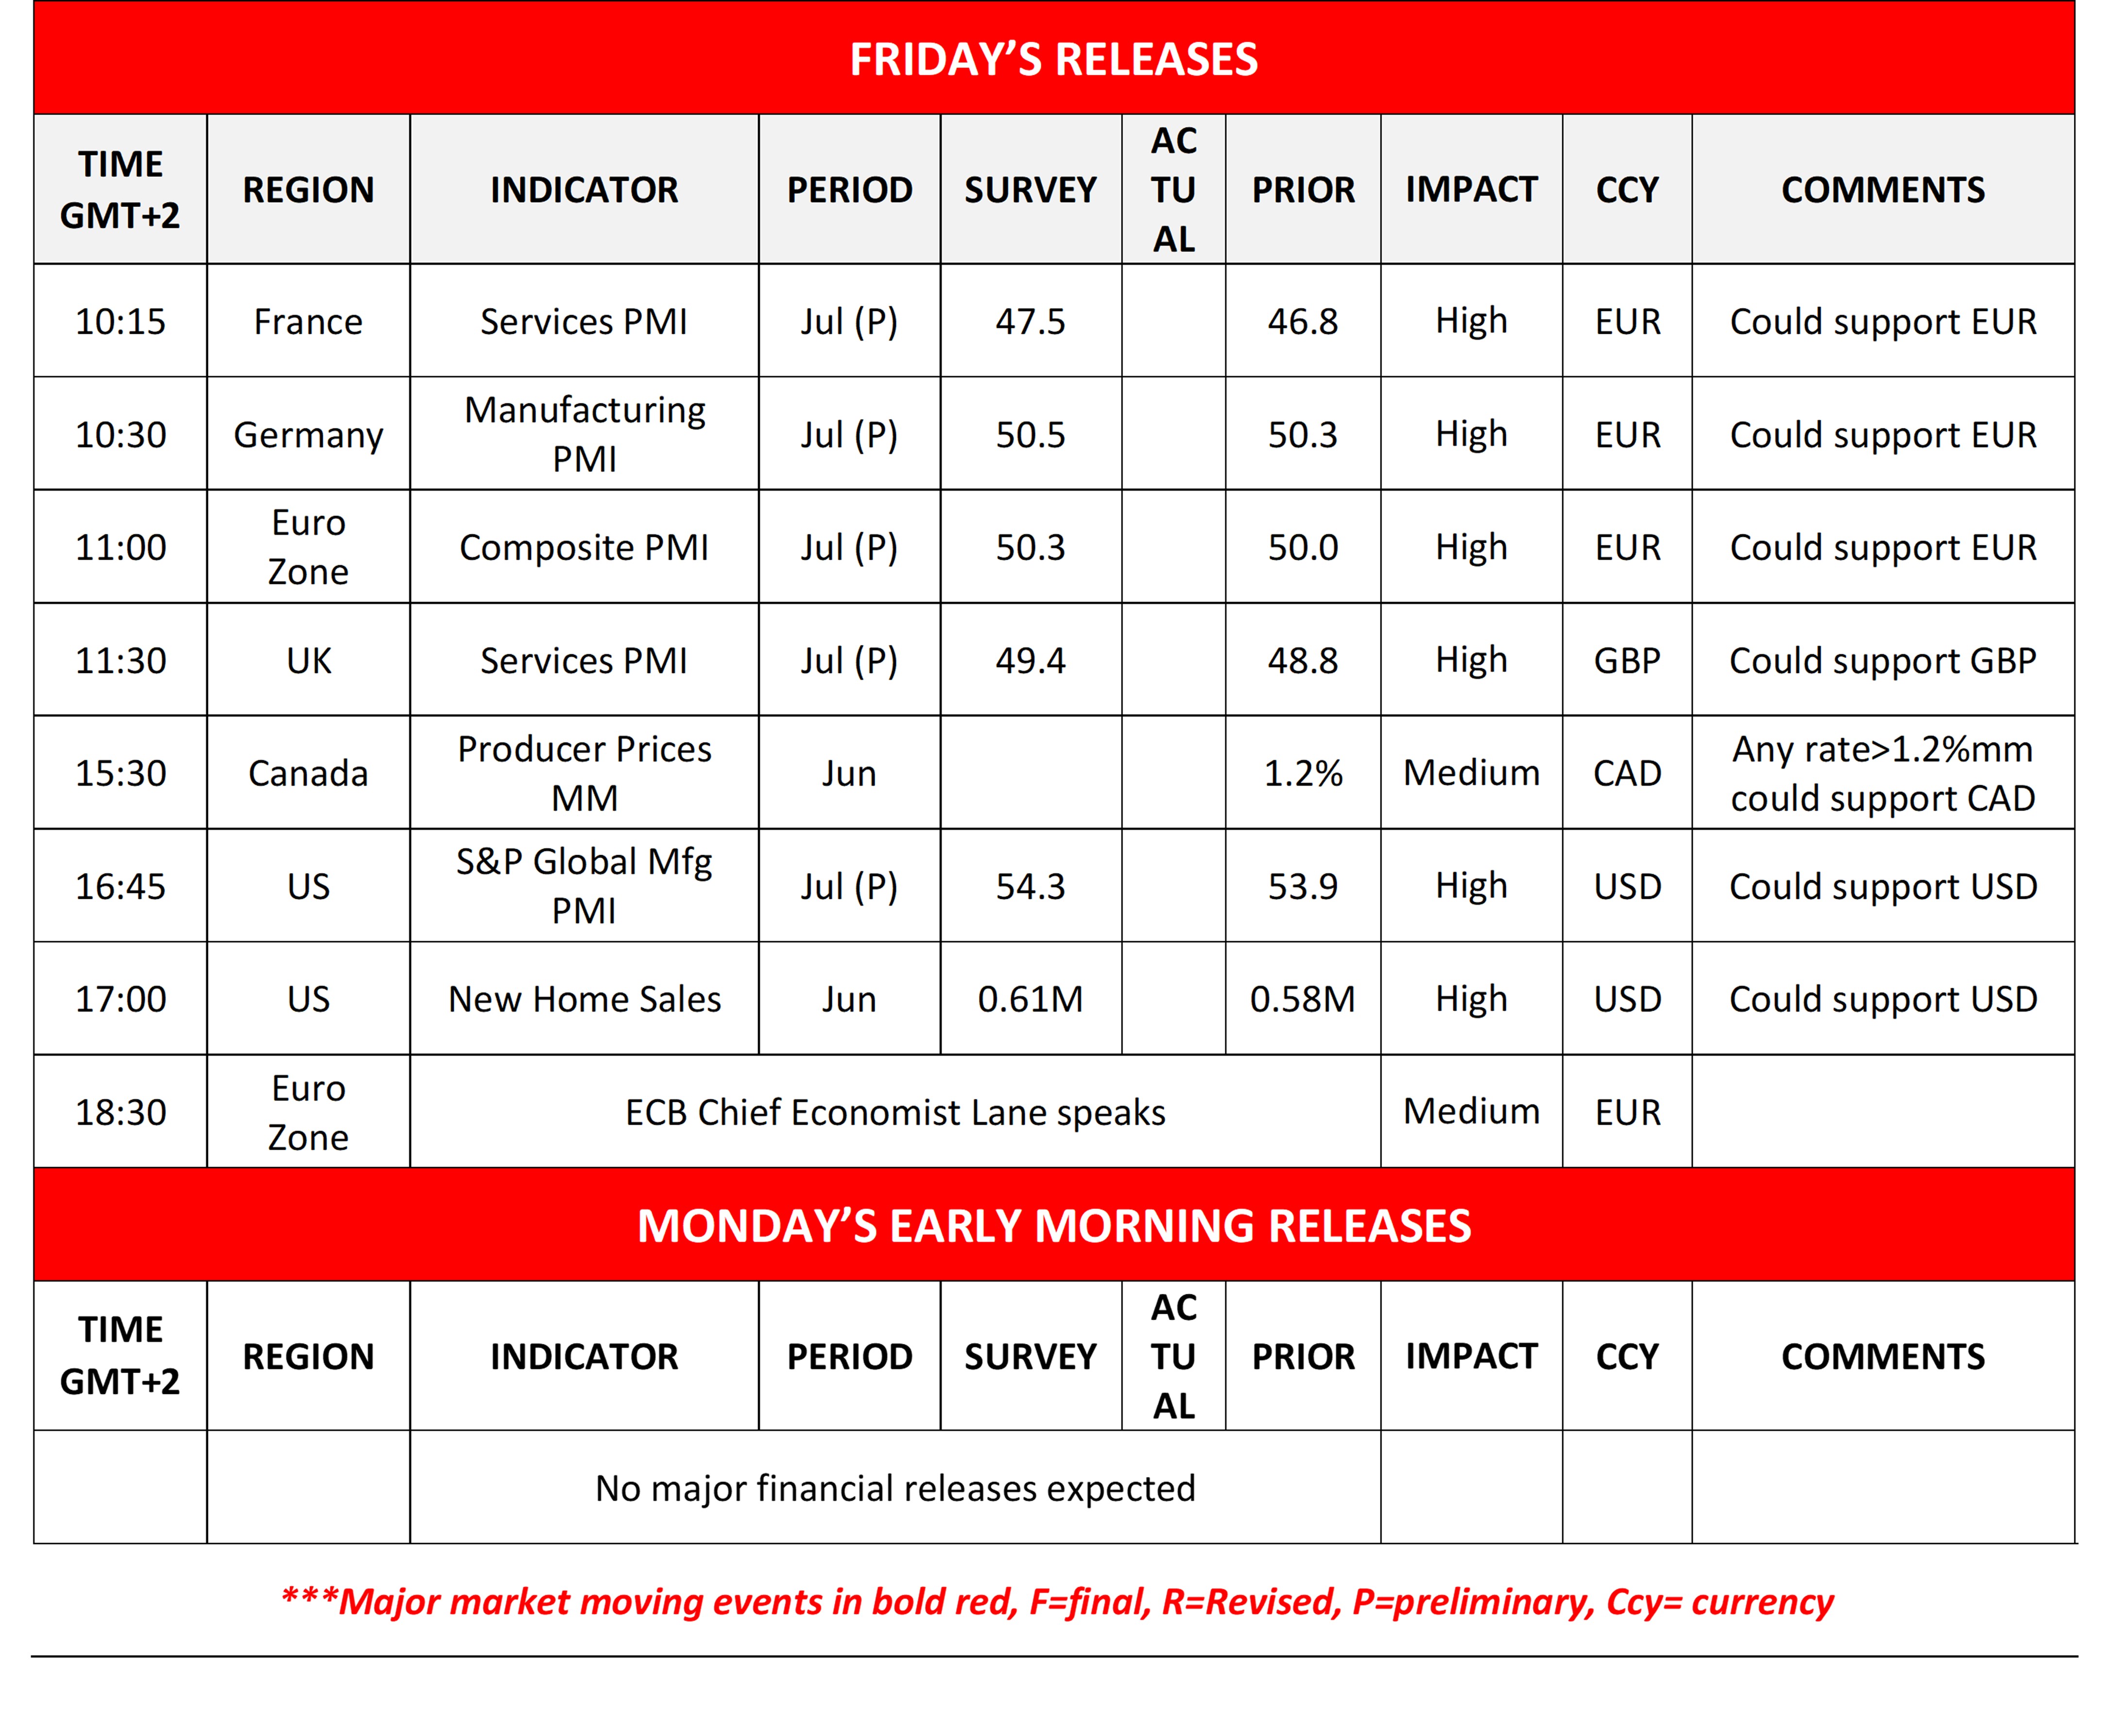
Today we get France’s Germany’s, the Euro Zone’s, the UK’s and the US preliminary PMI figures for July, Canada’s PPI rates for June, the US New Home Sales also for June, while ECB’s Chief Economist Lane speaks.
Charts to keep an eye out
USD/JPY’s price action continued to rise yesterday placing some distance between itself and the 162.80 (S1) support line. We maintain a bullish outlook for the pair and intend to keep as long as the upward trendline guiding it as long as the upward trendline guiding it remains intact. We note that the RSI indicator has reached the reading of 70, underscoring the strong bullish sentiment, yet at the same time suggests that the pair has reached overbought levels and may be ripe for a correction lower. We get similar signals from the flirting of the USD/JPY’s price action with the upper Bollinger band. Should the bulls remain in charge, we may see USD/JPY breaking the 165.50 (R1) resistance level and start aiming for the 168.00 (R2) base. Should the bears take over, we may see USD/JPY breaking the 162.80 (S1) line and start aiming for the 160.50 (S2) level.
WTI’s price continued to rise breaking the 88.60 (S1) resistance line, now turned to support. We maintain yesterday’s bullish outlook for the commodity’s price as long as the upward trendline guiding it remains intact. The rise of the RSI indicator, reaching 70 highlights the intensification of the bullish market sentiment, yet signals also the possibility of a correction lower, as WTI’s price may have reached overbought levels. Similar signals stem from the price action breaching the upper Bollinger band. Should the bulls maintain control, WTI may break the 93.30 (R1) line and start aiming for the 98.50 (R2) level. Should the bears take over, WTI may break the 88.60 (S1) line, and continue lower aiming for the 82.00 (S2) level.
USD/JPY Daily Chart
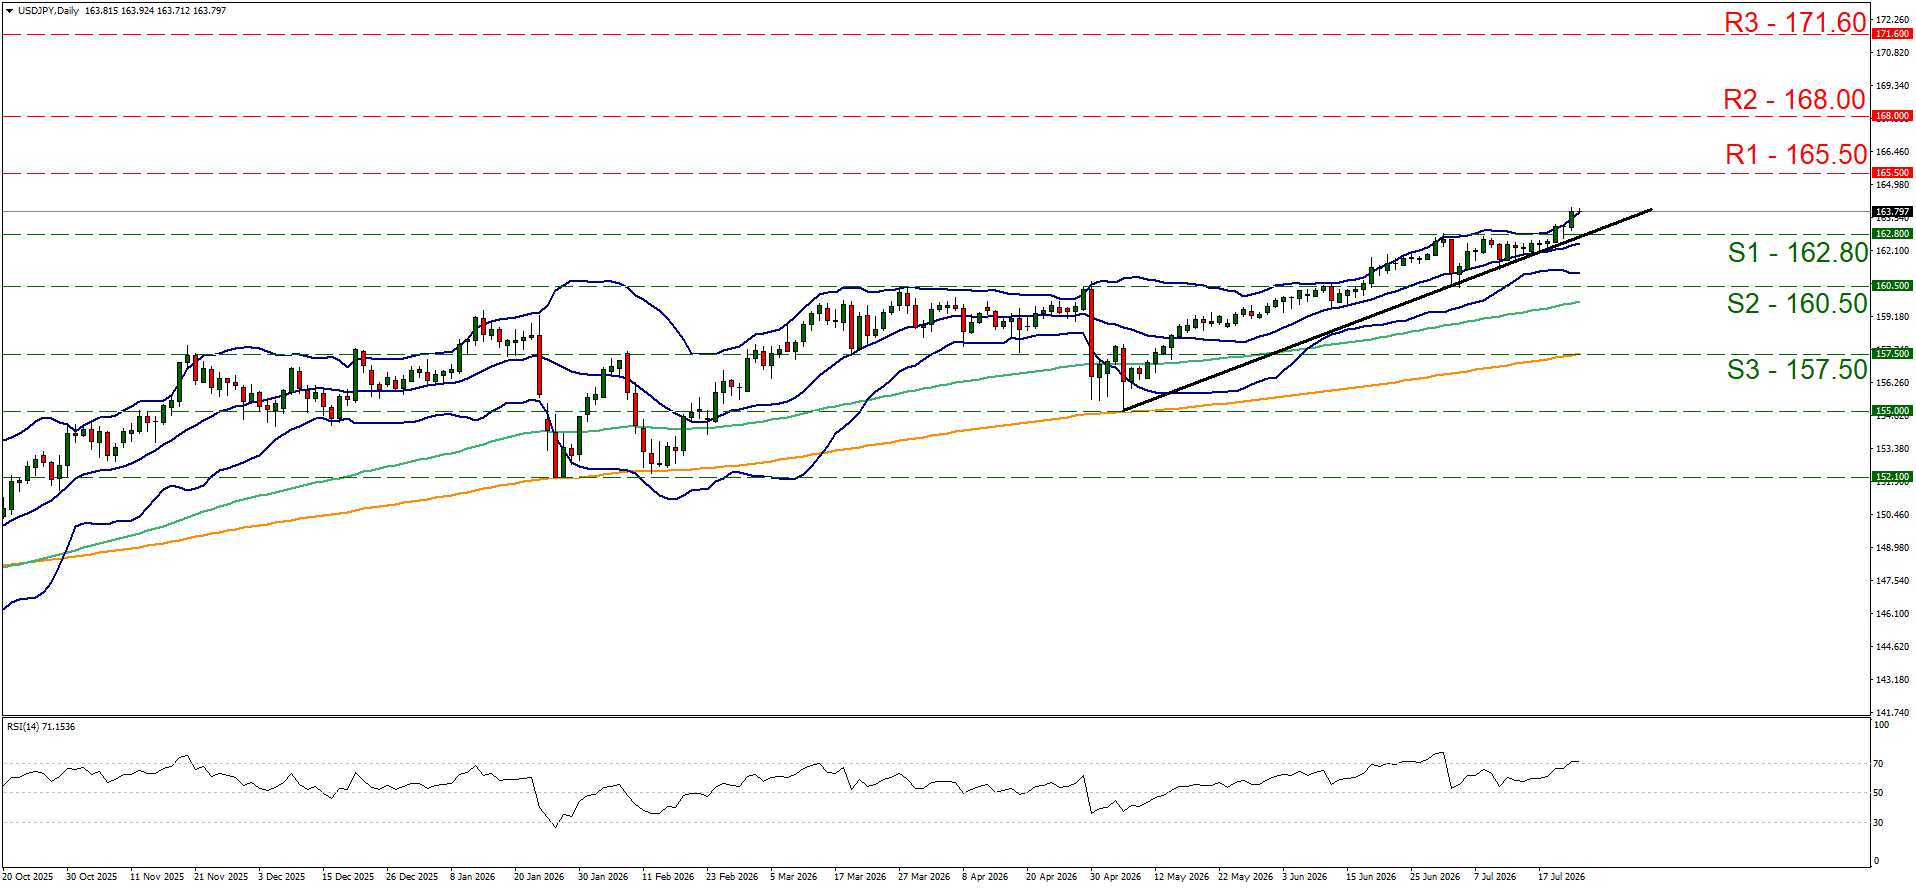
- Support: 162.80 (S1), 160.50 (S2), 157.50 (S3)
- Resistance: 165.50 (R1), 168.00 (R2), 171.60 (R3)
WTI Daily Chart
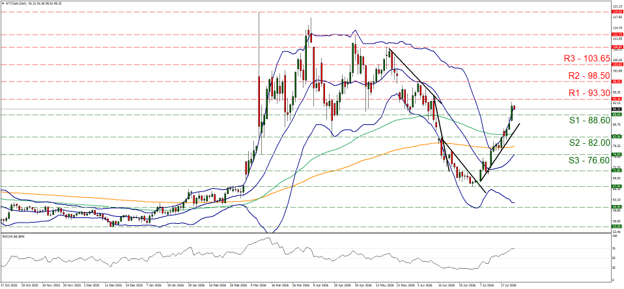
- Support: 88.60 (S1), 82.00 (S2), 76.60 (S3)
- Resistance: 93.30 (R1), 98.50 (R2), 103.65 (R3)
Isenção de responsabilidade:
Esta informação não é considerada como aconselhamento ou recomendação ao investimento, mas apenas como comunicação de marketing. O IronFX não é responsável por quaisquer dados ou pela informação fornecida por terceiros aqui mencionados, ou com links diretos, nesta comunicação.


