 PH
PH  EN
EN  FR
FR  ES
ES  KO
KO  PT
PT  ZH
ZH  AR
AR  FA
FA  RU
RU  NL
NL  MS
MS  VI
VI  TH
TH  ID
ID 

RBNZ about to hike rates after three years
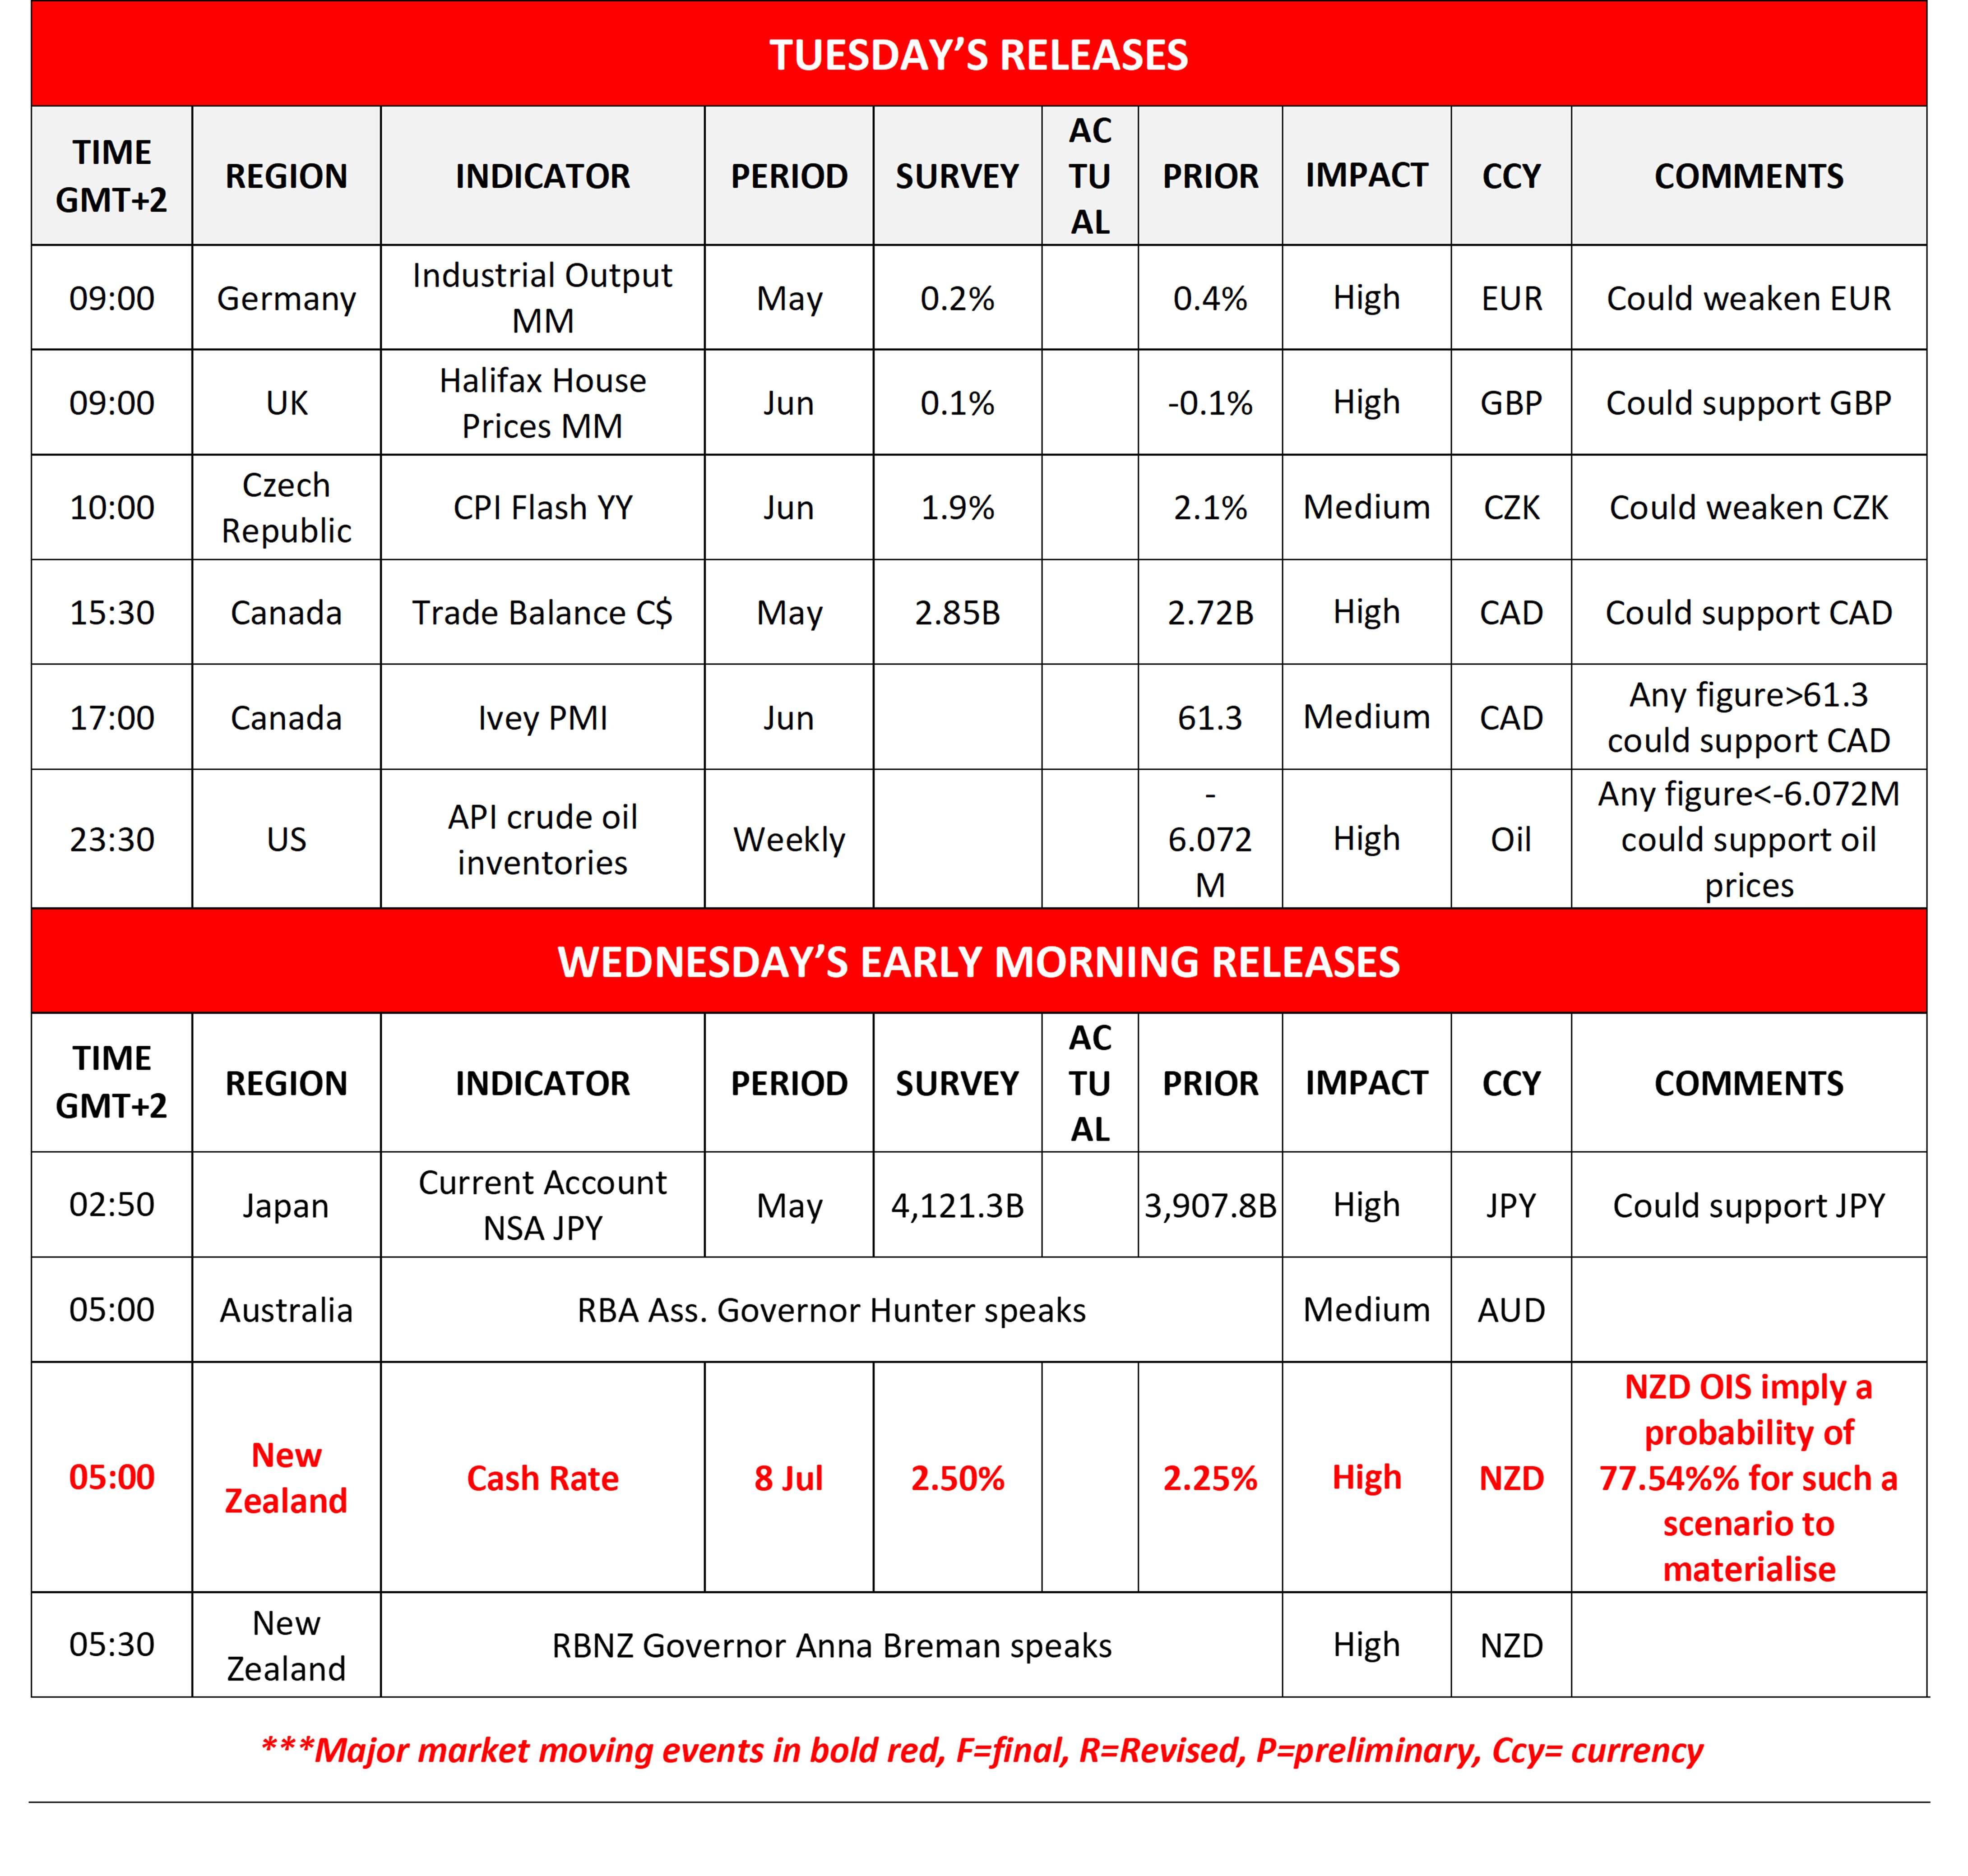
The USD seems to have halted its bearish movement in the FX market, Meanwhile, JPY continues to remain dangerously weak, and any further weakening can enhance the possibility of Japan intervening in the markets to the Yen’s rescue. In New Zealand RBNZ is expected to hike rates, while the market expects another hike, near October. If the bank hikes rates as expected and accompanies the decision with a hawkish tone, enhancing the market’s expectations we may see the Kiwi getting some support.
US stock markets remain uncertain
US stock markets continue to seem uncertain about their direction, with one exception being possibly Dow Jones. Nasdaq and S&P 500 were largely prevented from falling yesterday as Broadcom’s share price got some support after the extension of the chip-providing contract with Apple, yet on a fundamental basis US equity markets are still in a wait and see position, with the Fed’s stance being a key issue.
Oil prices remain stable despite tensions in the Gulf region
Oil prices seem to remain stable despite Iran firing missiles at commercial ships in the Strait of Hormuz. The incident rose doubts about the safety of the oil shipping route, yet the market tends to remain optimistic. The oil price cut by Saudi Arabia, the widest in reportedly two decades and expectations for OPEC+ to increase oil production tended to ease market worries somewhat.
Gold’s price slips
Gold’s price slipped as the strengthening of the USD in the FX market tended to weigh on the precious metal’s price. We still view the negative correlation of the USD with gold’s price as active hence any further gains for the USD could weigh on gold’s price and vice versa. Also we note the release of the Fed’s June meeting minutes tomorrow as a potential market mover for gold.
Other highlights for today
In today’s European session, we get Germany’s industrial output for May, UK’s Halifax House prices for June, the Czech Republic’s preliminary CPI rates for June, Canada’s trade data for May and Ivey PMI figure for June and later on we get the API weekly crude oil inventories figure. In tomorrow’s Asian session we get Japan’s Current Account balance for May and on a monetary level we note that RBA Assistant Governor Hunter are scheduled to speak and in New Zealand, RBNZ is to release its interest rate decision.
Charts to keep an eye out
NZD/USD edged lower in today’s Asian session nearing the 0.5680 (S1) support line. We tend to maintain our bias for a sideways motion of the pair, after its price action broke the down ward trendline guiding it. Yet the low position of the RSI indicator, implies some bearish tendencies in the market sentiment that could drag NZD/USD’s price action lower. Should the bears fully take over, we may see NZD/USD breaking the 0.5680 (S1) support line and start aiming for the 0.5575 (S2) support level. For the bulls to establish their dominance, NZD/USD would have to break the 0.5765 (R1) resistance line, thus opening the gates for the 0.5865 (R2) resistance level.
Nasdaq’s price edged lower unable to break the 29675 (R1) resistance line. The index’s price action seems to have been condensed within the boundaries of a symmetrical triangle, a scenario that allows the break out of index’s price action to either direction. Should the bears regain control over Nasdaq’s price we may see it nearing the aiming if not breaking the 28200 (S1) support line. Should the bulls take over we may see Nasdaq’s price breaking the 29675 (R1) resistance line and start aiming if not reaching the 30770 (R2) resistance level.
NZD/USD Daily Chart
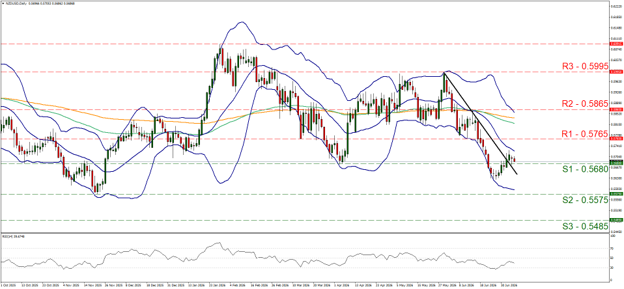
- Support: 0.5680 (S1), 0.5575 (S2), 0.5485 (S3)
- Resistance: 0.5765 (R1), 0.5865 (R2), 0.5995 (R3)
US100 Cash Daily Chart
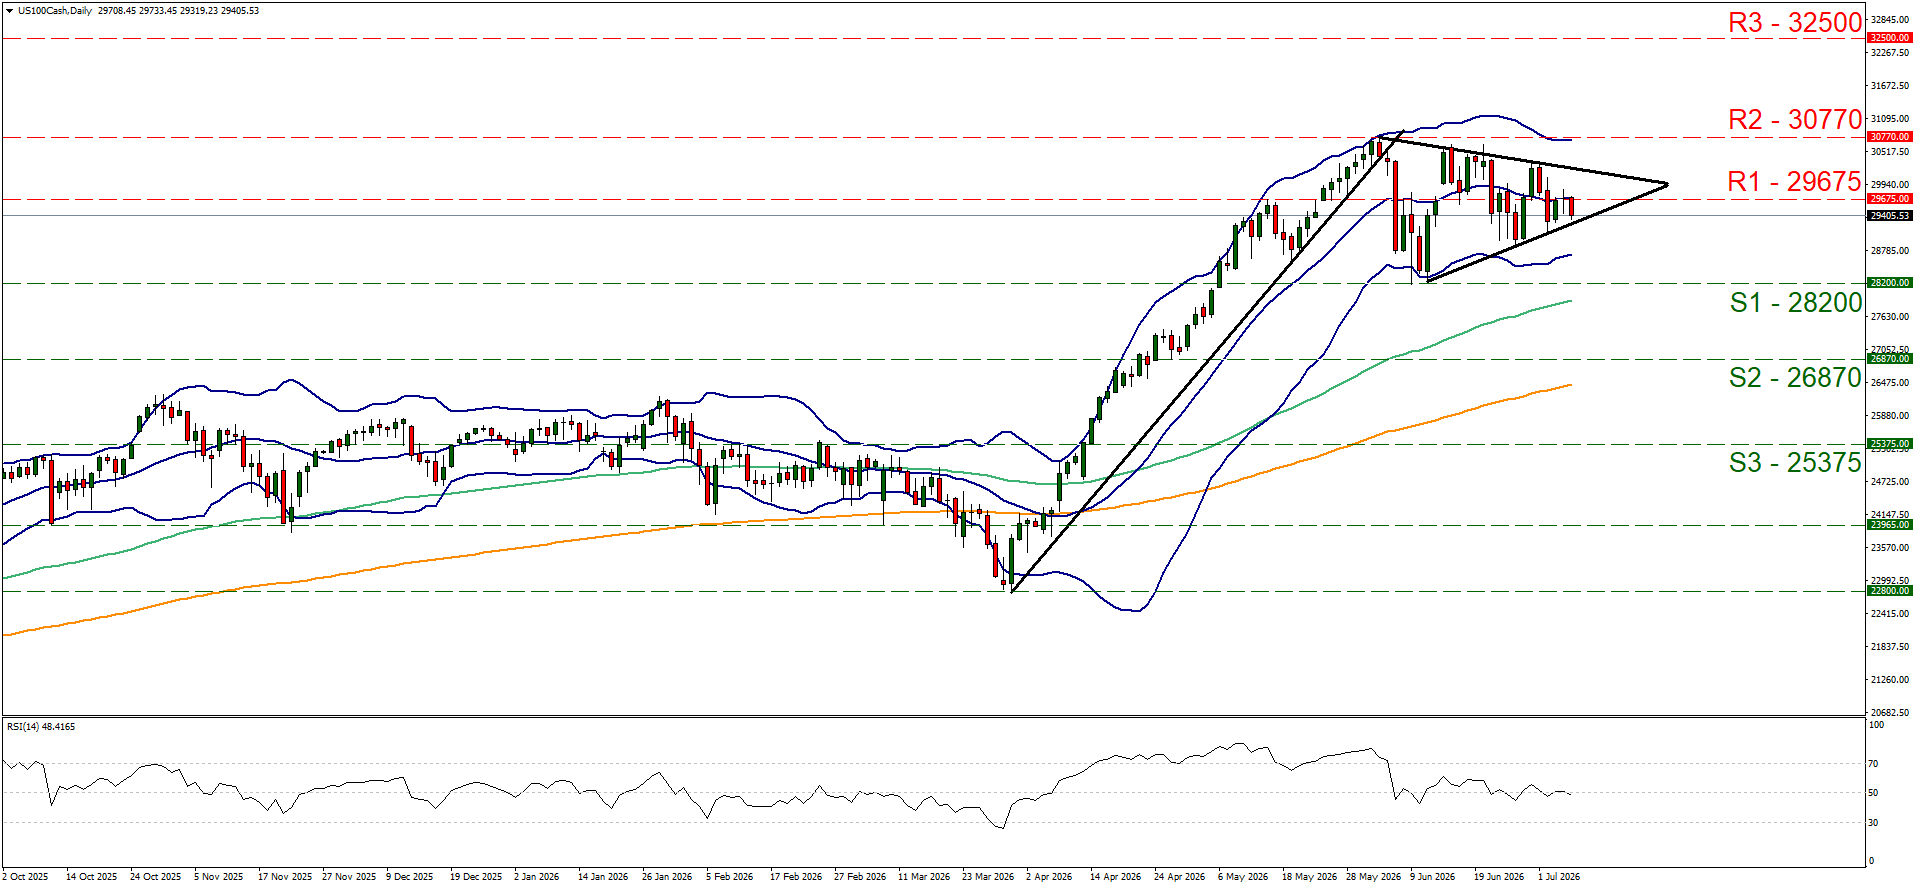
- Support: 28200 (S1), 26870 (S2), 25375 (S3)
- Resistance: 29675 (R1), 30770 (R2), 32500 (R3)
Disclaimer:
This information is not considered as investment advice or an investment recommendation, but instead a marketing communication. IronFX is not responsible for any data or information provided by third parties referenced, or hyperlinked, in this communication.


