
Doubts for the US-Iranian negotiations enhanced as markets remain cautious about the next steps in the conflict, supporting safe-haven demand for the USD and keeping oil prices on an upward path.
At the same time, US stock markets delivered mixed signals, while Bitcoin extended its gains as risk appetite improved.
Traders now shift attention to key PMI releases and US jobless claims data, which may shape market direction.
USD gains the initiative in the FX market
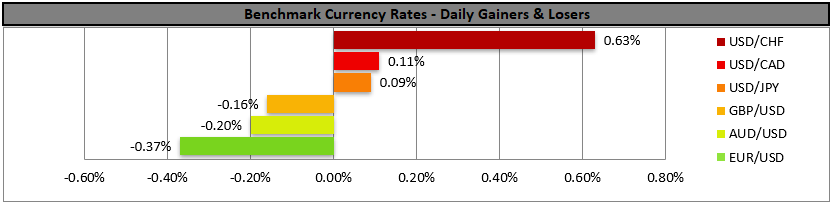
The USD gained across the board in the FX market yesterday. The market’s worries for an impasse in the US-Iranian conflict in combination with the USD’s safe-haven status provided tailwinds for the greenback.
Despite the USD’s safe haven status being currently the main determinant of its direction we also note today, the release of the US weekly initial jobless claims figure and the preliminary PMI figures for April as possible market movers for the USD.
Mixed signals from US stock markets
US stock market indexes tended to provide some mixed signals yesterday. Nasdaq and S&P 500 were on the rise, but not Dow Jones. Fundamentally, strong earnings reports tend to keep morale high and maintain a disconnect with conditions on the ground of the US economy.
Tesla’s and IBM’s earnings reports showed that Revenue and EPS figures beat market expectations, yet market worries for the way forward tend to remain. Today, we highlight in the aftermarket hours the earnings report of Intel.
Lack of progress in US-Iran negotiations push oil prices higher
Oil prices continued to rise yesterday and in today’s Asian session. It should be noted that the US despite declaring a permanent ceasefire, continues to block Iranian ports, while Iran seized two ships in the Strait of Hormuz yesterday.
Market doubts on whether US-Iranian negotiations are to restart tend to remain providing tailwinds for oil bulls on a fundamental level.
Bitcoin gains on bullish tendencies
Bitcoin was on the rise yesterday, as US President Trump’s ceasefire turned the market sentiment more risk-on, allowing the cryptocurrency to benefit given its riskier nature.
Also increased investments by Strategy on Bitcoin and ETF institutional inflows, tend to give positive signals for the cryptocurrency’s outlook.
Other highlights for today
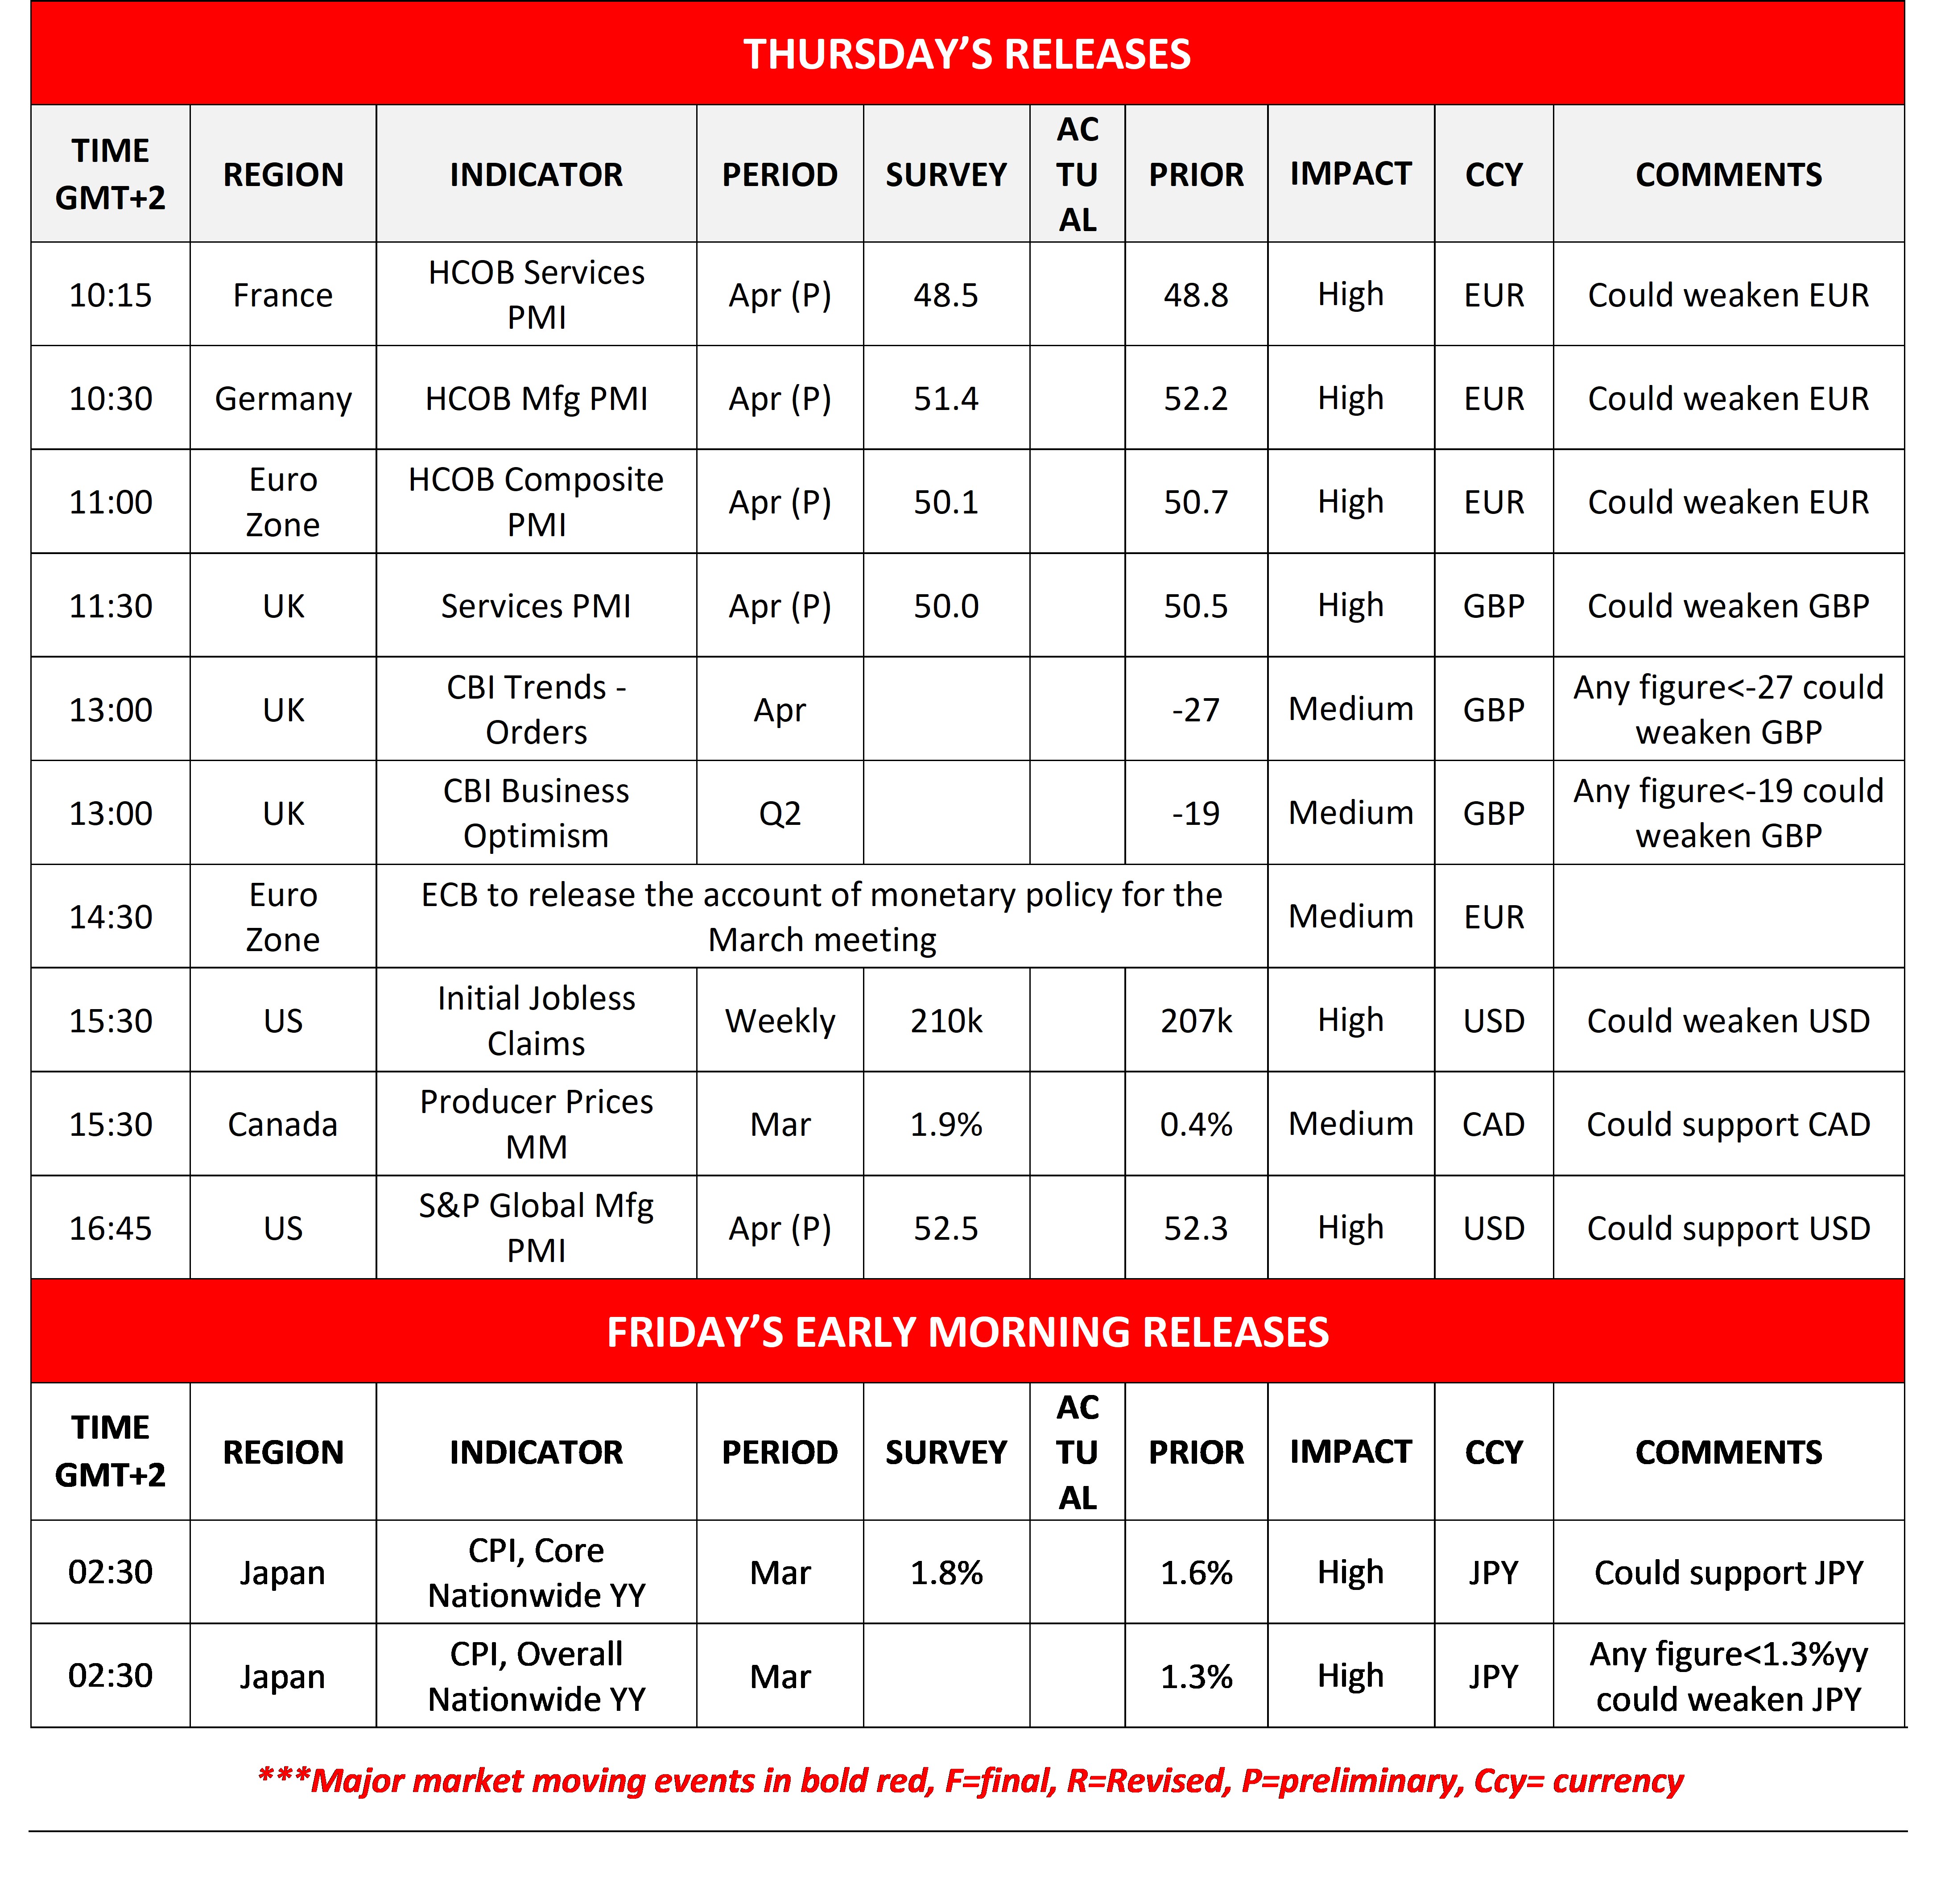
Today we get France’s, Germany’s, the Euro Zone’s as a whole, the UK’s and the US’s preliminary PMI figures for April, the UK’s CBI indicators for industrial orders and business optimism for April and Q2 26 respectively and Canada’s PPI rates for March. In tomorrow’s Asian session, we get Japan’s CPI rates for March.
Charts to keep an eye out
WTI’s
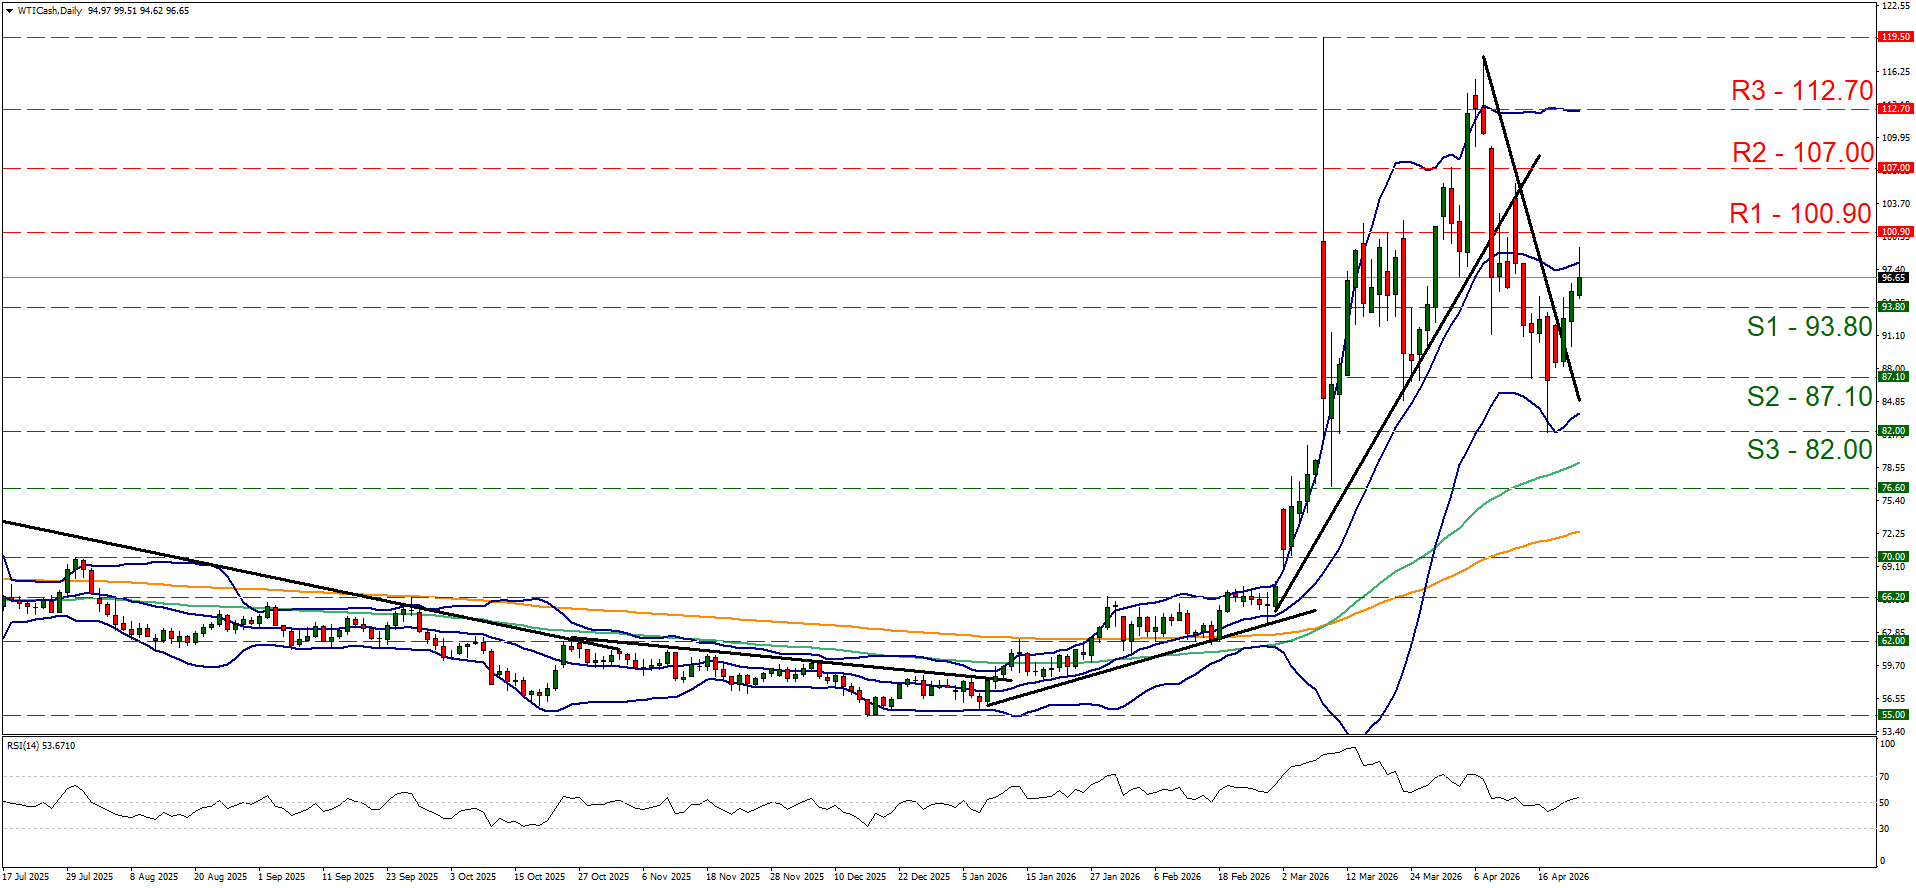
WTI’s price continued to rise yesterday and in today’s Asian session, breaking the 93.80 (S1) resistance line, now turned to support. Given that the commodity’s price action broke the upper boundary set for a sideways motion we switch our sideways motion bias in favour of a bullish outlook.
We note though that the bullish market sentiment may still be low, as the RSI indicator remains just above the reading of 50. Should the bulls continue to lead WTI’s price, we may see it reaching if not breaching the 100.90 (R1) resistance line with the next target for the bulls being set at the 107.00 (R2) resistance level.
Should the bears take over, we may see WTIU’s price action dropping below the 93.80 (S1) support line and start aiming for the 87.10 (S2) level.
Nasdaq
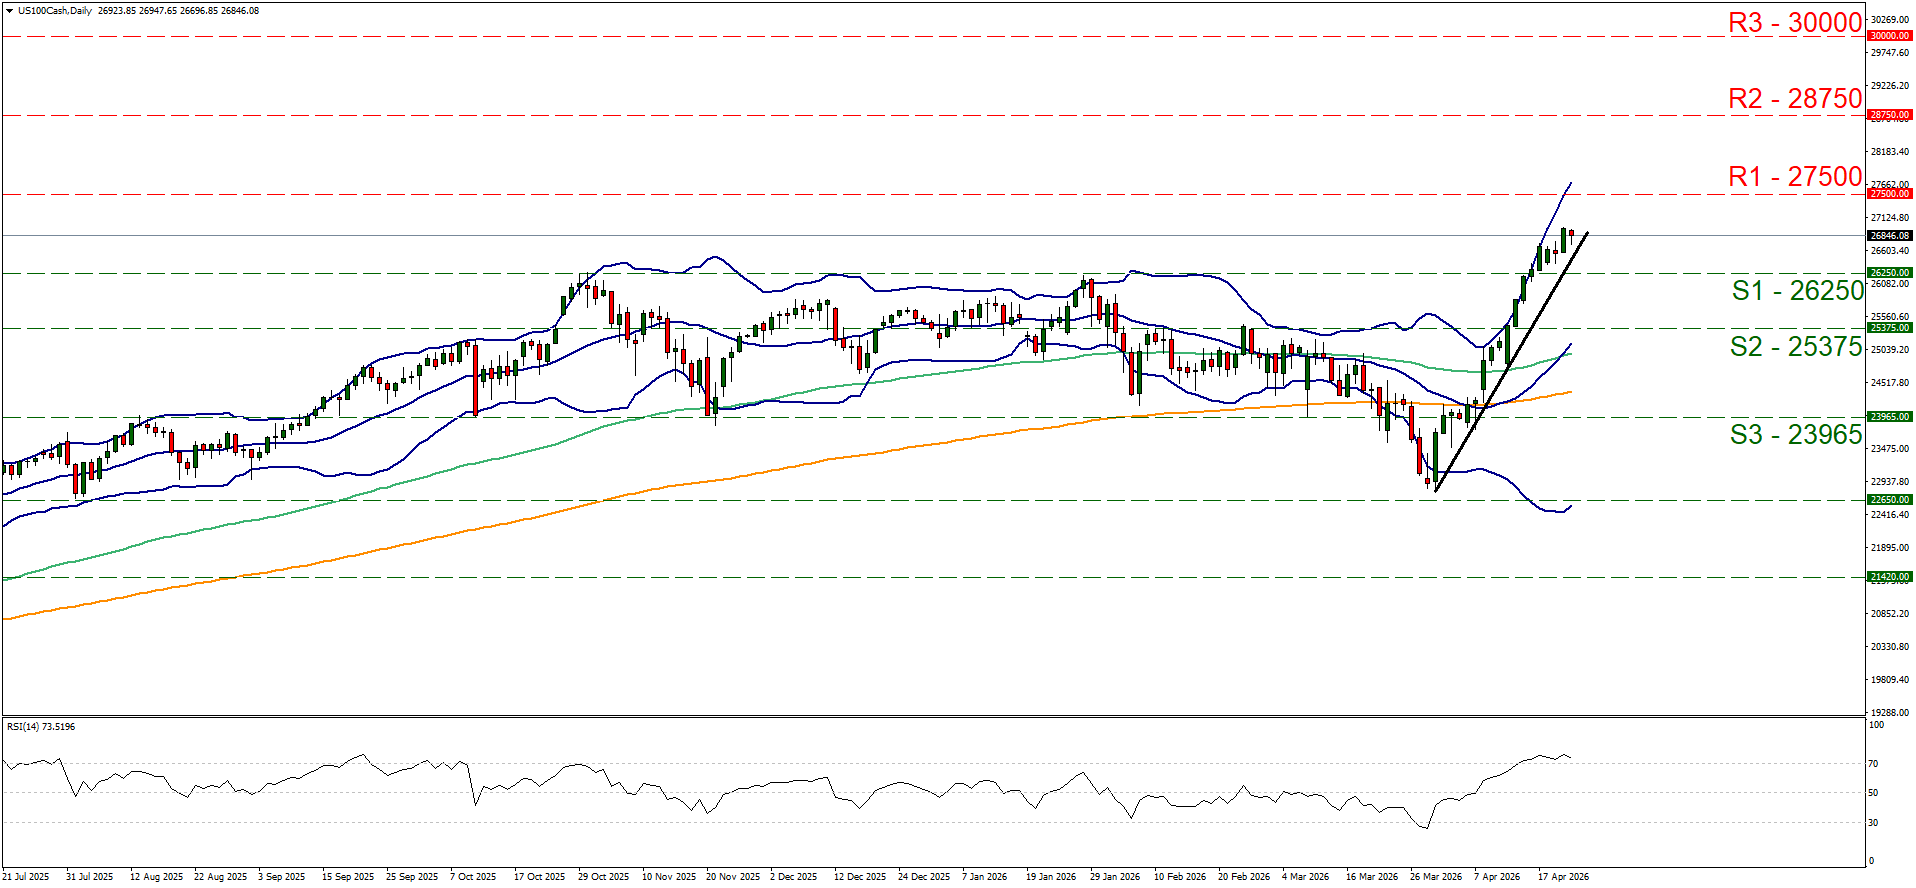
Nasdaq continued to rise yesterday, placing more distance between its price action and the 26250 (S1) support line.
We maintain a bullish outlook for the index and intend to keep it as long as the upward trendline guiding it remains intact. The RSI indicator remains above the reading of 70, implying a possibly overbought situation for the index and implying that a correction lower is also possible.
Should the bulls remain in charge, we may see Nasdaq reaching new All Time High levels by aiming the 27500 (R1) resistance line.
For a bearish outlook to emerge we would require the index’s price action to break initially the prementioned upward trendline continue to break also the 26250 (S1) support line and start aggressively aiming if not breaching also the 25375 (S2) support level.
WTI Daily Chart
- Support: 93.80 (S1), 87.10 (S2), 82.00 (S3)
- Resistance: 100.90 (R1), 107.00 (R2), 112.70 (R3)
US 100 Cash Daily Chart
- Support: 26250 (S1), 25375 (S2), 23965 (S3)
- Resistance: 27500 (R1), 28750 (R2), 30000 (R3)
Disclaimer:
This information is not considered as investment advice or an investment recommendation, but instead a marketing communication. IronFX is not responsible for any data or information provided by third parties referenced, or hyperlinked, in this communication.