
Tensions rise in the Middle East as the US-Iran standoff deepens, boosting global market uncertainty and fueling safe-haven demand.
The USD continues to strengthen against major counterparts, while oil prices remain supported by escalating geopolitical risks around the Strait of Hormuz.
Meanwhile, US equity markets show signs of hesitation as investors reassess risk appetite and focus on upcoming key economic releases.
The USD continues to rise
The greenback continued to gain against its counterparts in the FX market yesterday and is preparing to end the week in the greens.
The impasse of the US and Iran tends to enhance market worries for the conflict to escalate substantially driving safe haven inflows into the USD.
North of the US border we note the weakening of the CAD against the USD and today we get the Canada’s retail sales, and a possibly wider deceleration of the rate could weigh on the CAD.
Oil prices continue to rise as tensions escalate
Oil prices continued to gain yesterday, stabilizing somewhat during today’s Asian session.
Market worries for the situation in the Middle East continue to be enhanced and feed oil bulls. Iran released footage of commandos boarding a vessel at the Straits of Hormuz, underscoring its dominance over the passage while there were reports of air attacks on Tehran.
US President Trump seems not being in a hurry and overall the ceasefire phase is starts looking more like a preparative stage for a confrontation at a later stage.
US Equities bulls seem to hesitate
Major US stock market indexes unanimously dropped yesterday in a signal of hesitation on behalf of US stock market bulls.
Market worries for a protraction of the US-Iranian conflict seem to be enhanced, diluting the positive market sentiment as do enhanced market worries for a possible disruptive role AI may have.
Also, we highlight the better-than-expected EPS and revenue figures in Intel’s earnings report yesterday as well as its robust forward guidance, all supporting its share price.
Gold continues to extend losses
Gold’s price continued to move lower yesterday as the strengthening of the USD tended to weigh. Safe haven inflows and possible Fed intentions for a tighter monetary policy both seem to be supportive for the greenback.
Overall, we see the negative correlation between the two trading instruments as being active currently yet size of the movement remains asymmetrical.
금일 주요 경제 뉴스
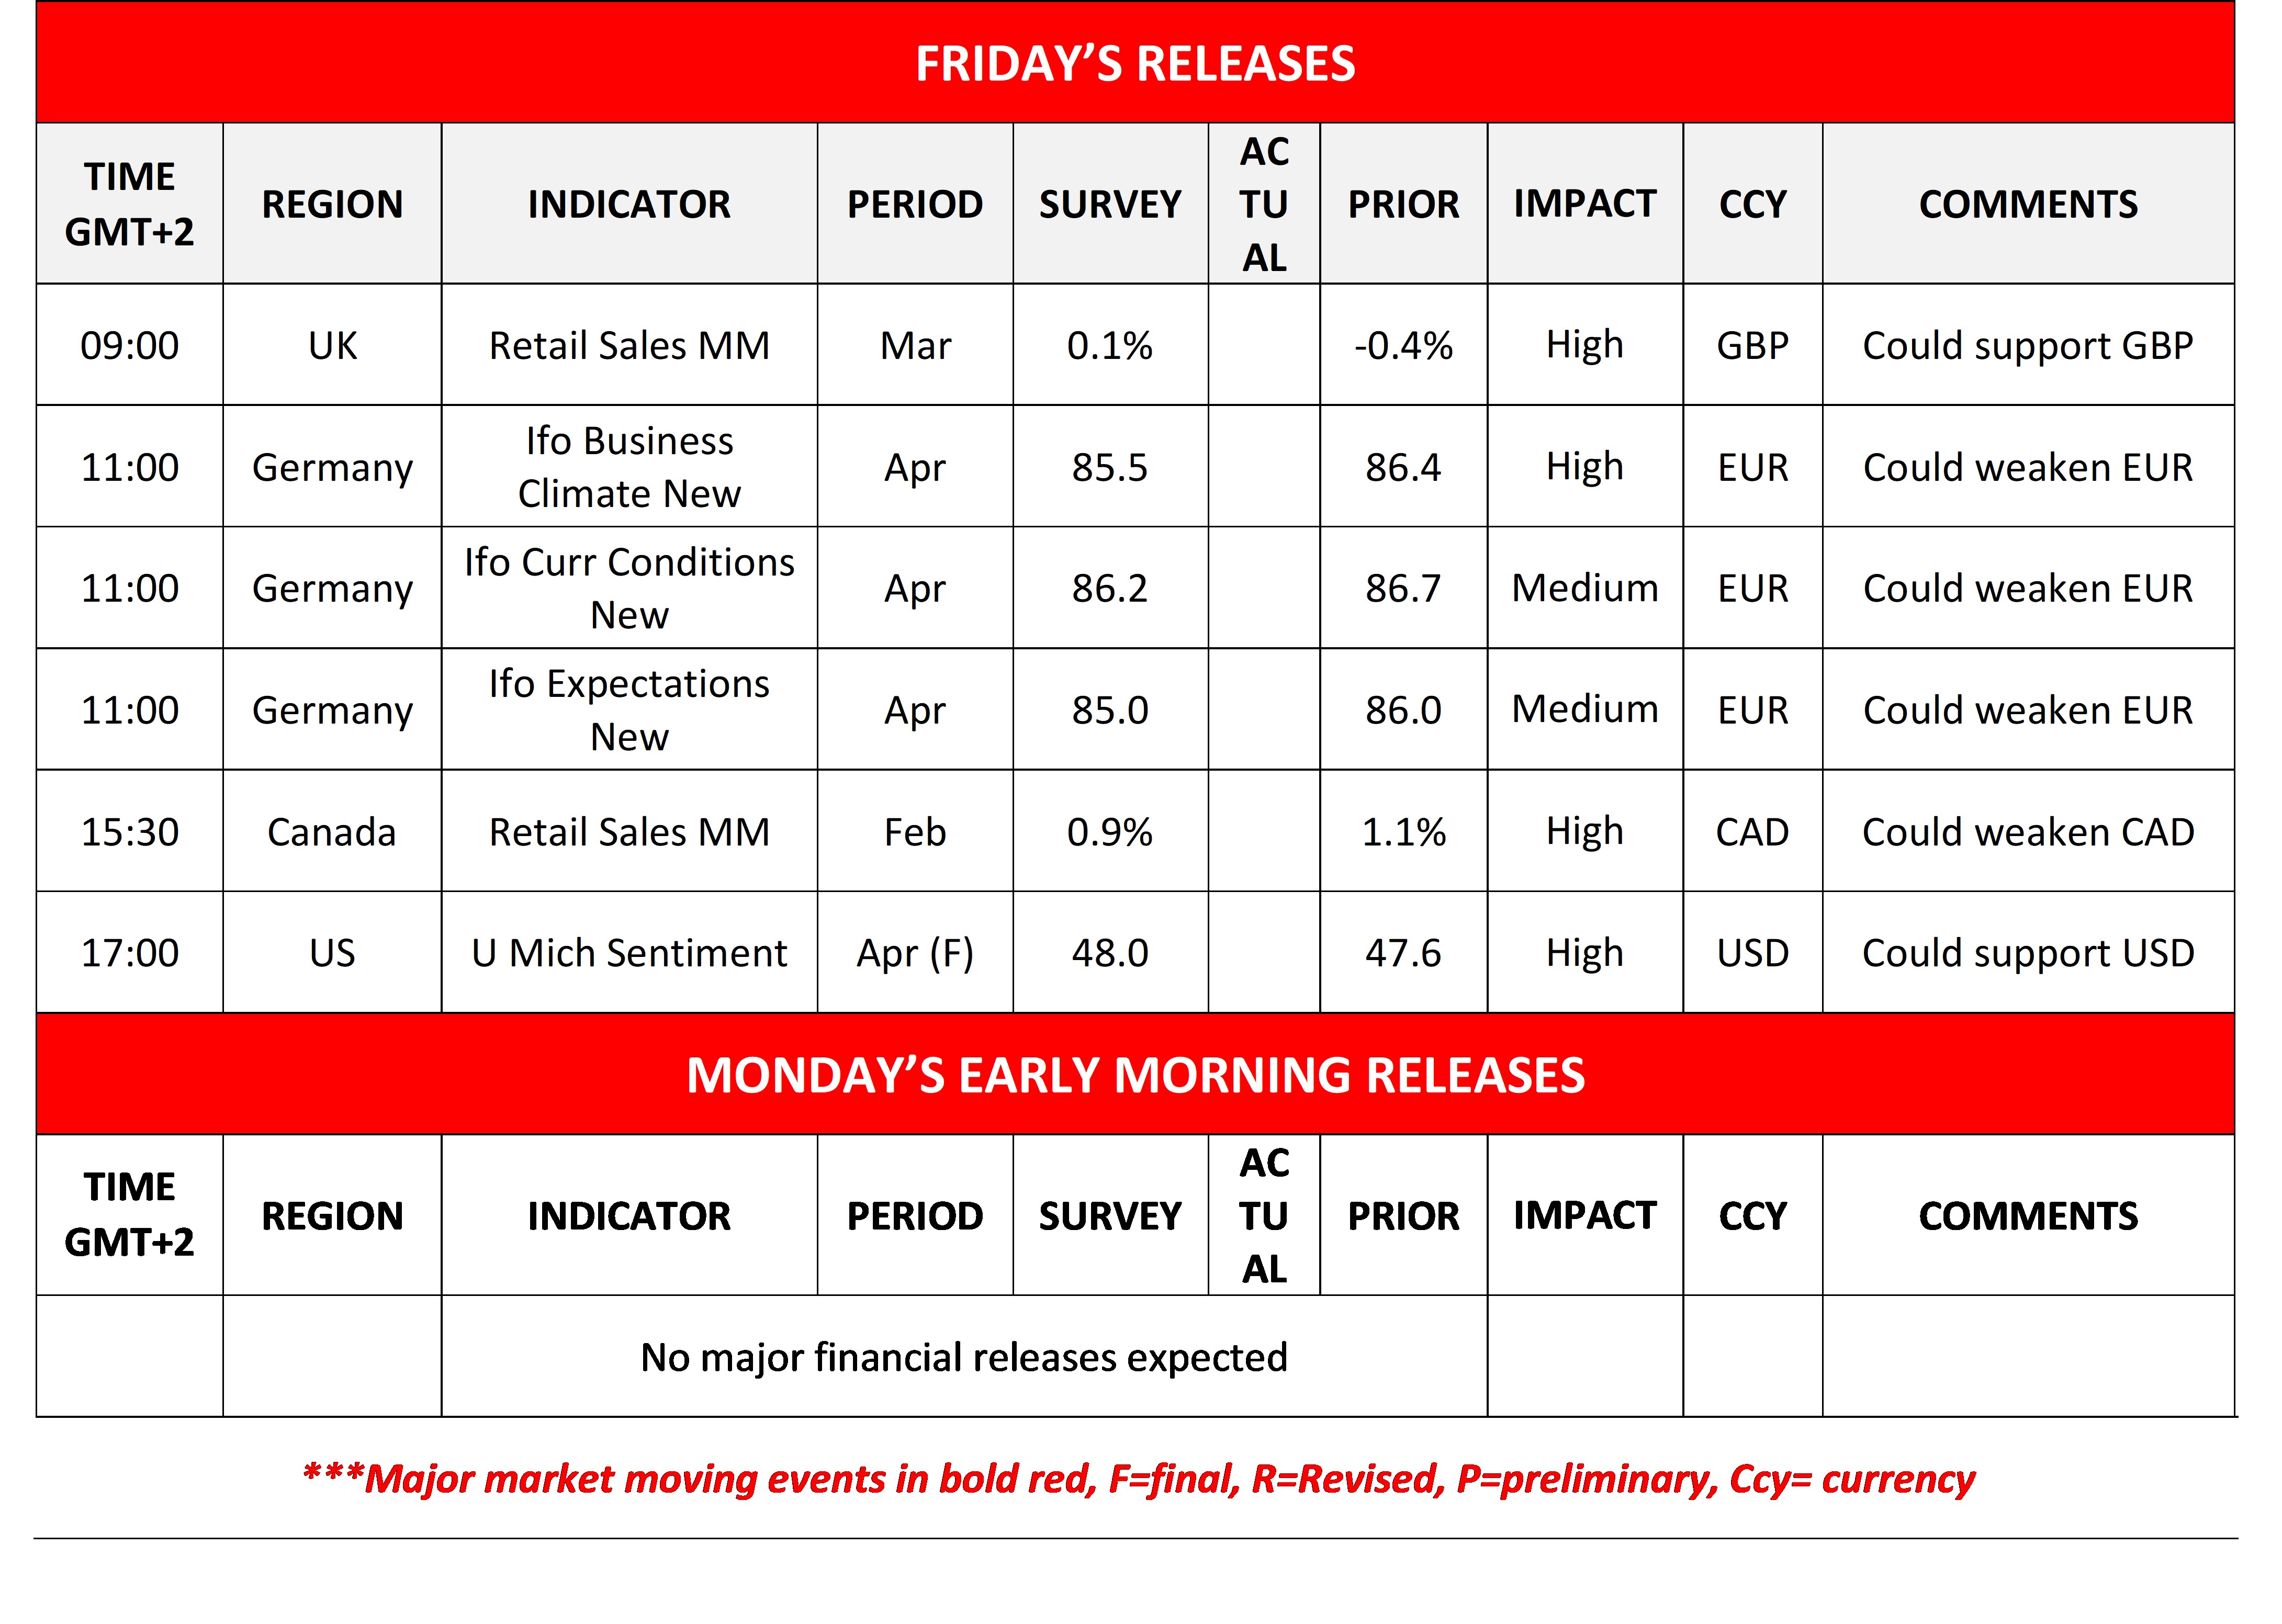
Today we get UK’s retail sales for March, Germany’s April Ifo indicators and the US the UoM final consumer sentiment for April.
Charts to keep an eye out
WTI’s
WTI’s price continued to rise yesterday testing at some point the 100.90 (R1) resistance line.
We maintain our bullish outlook for the commodity’s price, yet note that the RSI indicator has failed to rise significantly, remaining slightly above the reading of 50.
Should the bulls continue to lead WTI’s price, we may see it breaching the 100.90 (R1) resistance line with the next target for the bulls being set at the 107.00 (R2) resistance level.
Should the bears take over, we may see WTIU’s price action dropping below the 93.80 (S1) support line and start aiming for the 87.10 (S2) level.
Nasdaq
Nasdaq corrected lower yesterday, remaining well within the boundaries set by the 27500 (R1) resistance line and the 26250 (S1) support level. We maintain a bullish outlook for the index as long as the upward trendline guiding it remains intact.
The RSI indicator remains above the reading of 70, implying an overbought situation for the index and that a correction lower is possible. Yet the index’s price action is below the upper Bollinger band, implying that there is some room for the bulls to play.
Should the bulls remain in charge, we may see Nasdaq reaching new All Time High levels by aiming the 27500 (R1) line. For a bearish outlook to emerge we would require the index’s price action to break initially the prementioned upward trendline continue to break also the 26250 (S1) line and start aiming for the 25375 (S2) support level.

WTI Daily Chart
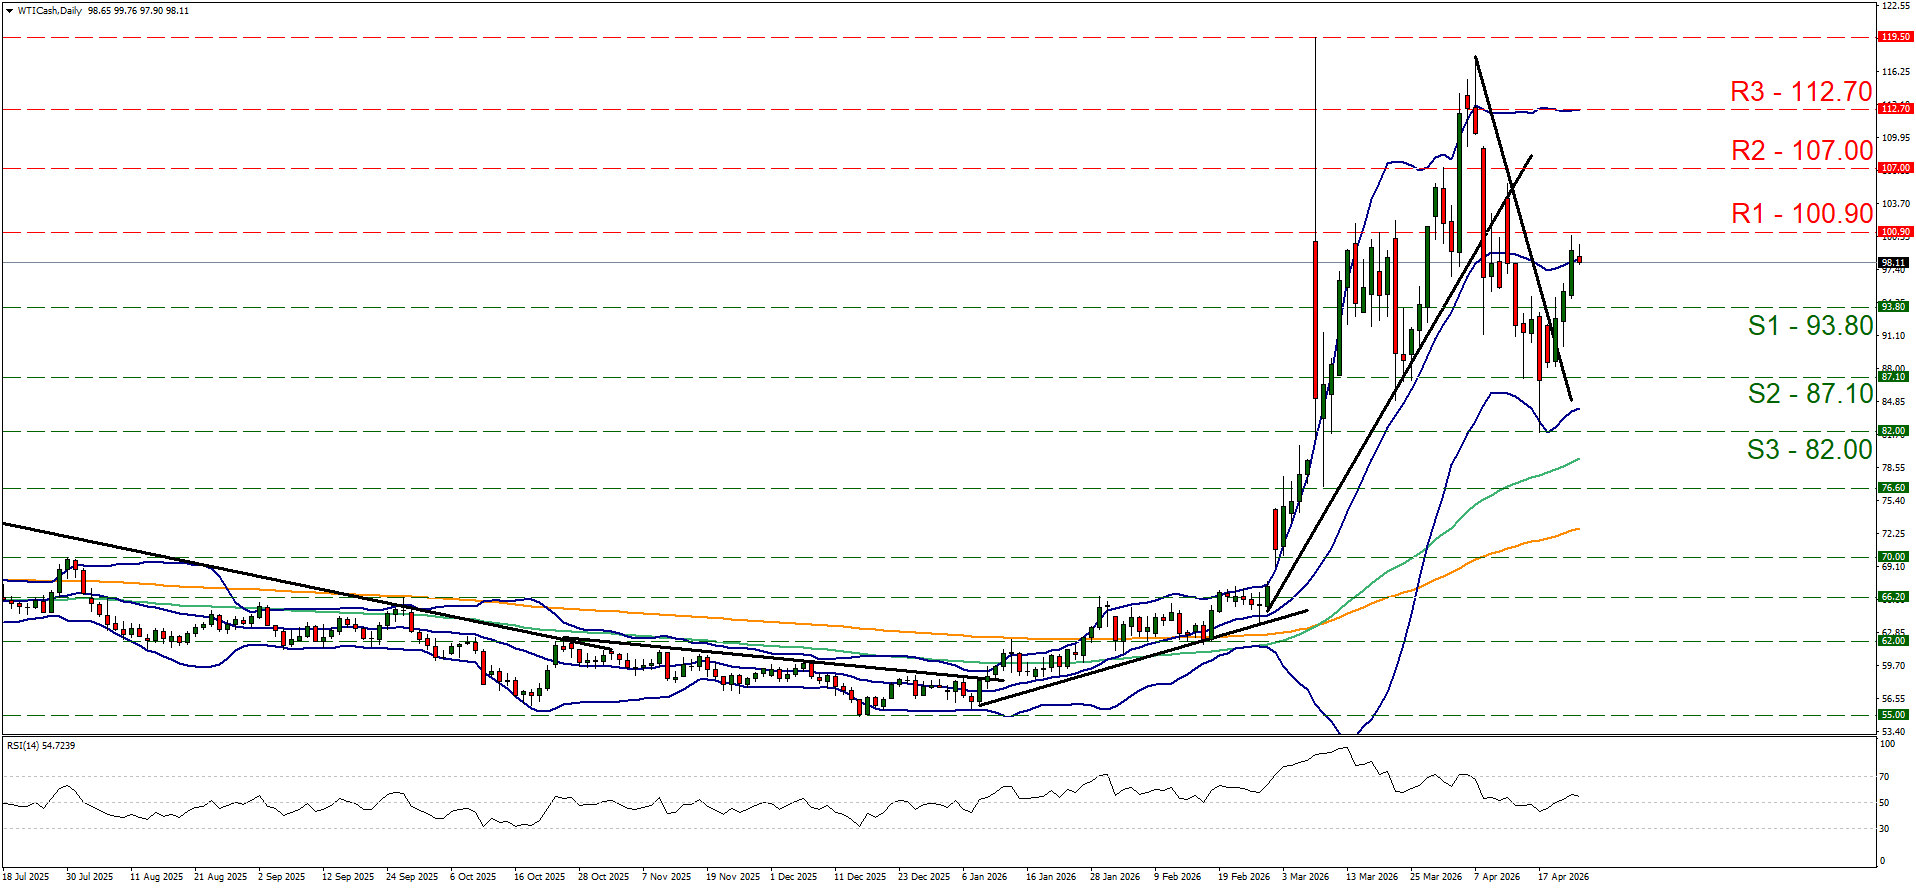
- Support: 93.80 (S1), 87.10 (S2), 82.00 (S3)
- Resistance: 100.90 (R1), 107.00 (R2), 112.70 (R3)
US 100 Cash Daily Chart
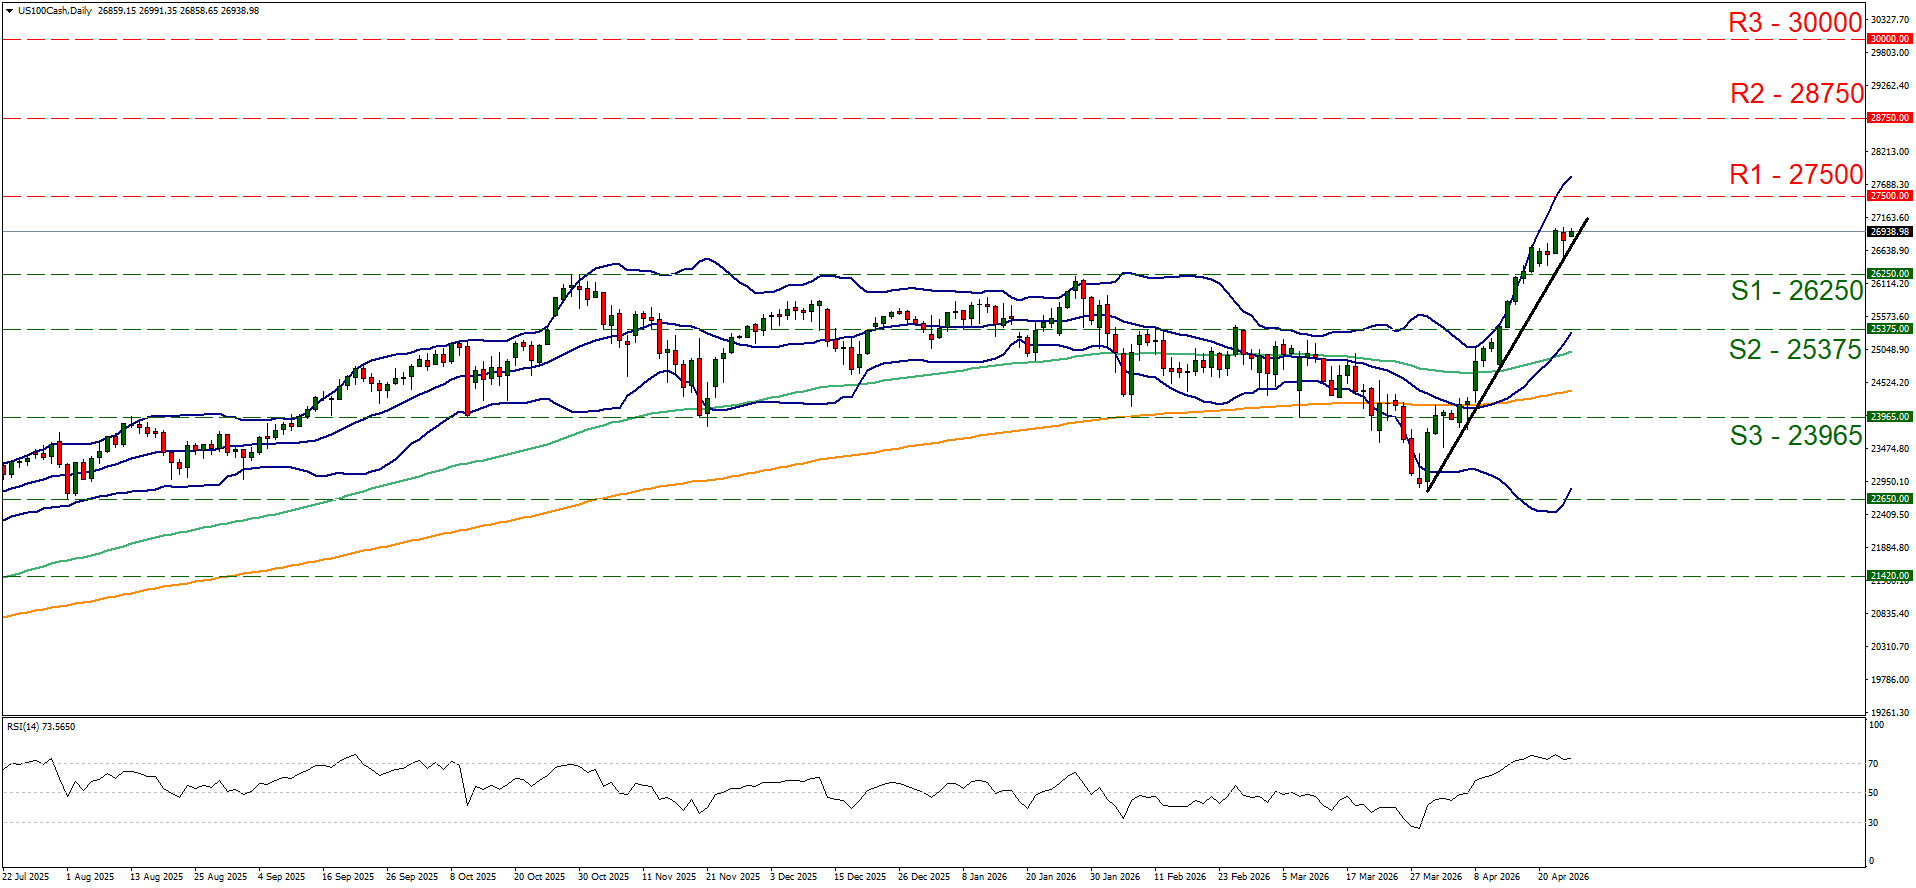
- Support: 26250 (S1), 25375 (S2), 23965 (S3)
- Resistance: 27500 (R1), 28750 (R2), 30000 (R3)
면책 조항:
본 자료는 투자 권유가 아니며 정보 전달의 목적이므로 참조만 하시기 바랍니다. IronFX는 본 자료 내에서 제 3자가 이용하거나 링크를 연결한 데이터 또는 정보에 대해 책임이 없습니다.