
Market worries for US-Iran conflict renewed are driving cautious sentiment across global markets, as rising Middle East tensions push oil prices higher and keep inflation concerns elevated. Despite the risk-off tone, the USD edged lower in Asian trading, while US stock indices weakened further and traders closely monitor WTI and Nasdaq for the next key breakout levels.
USD edges lower despite market worries
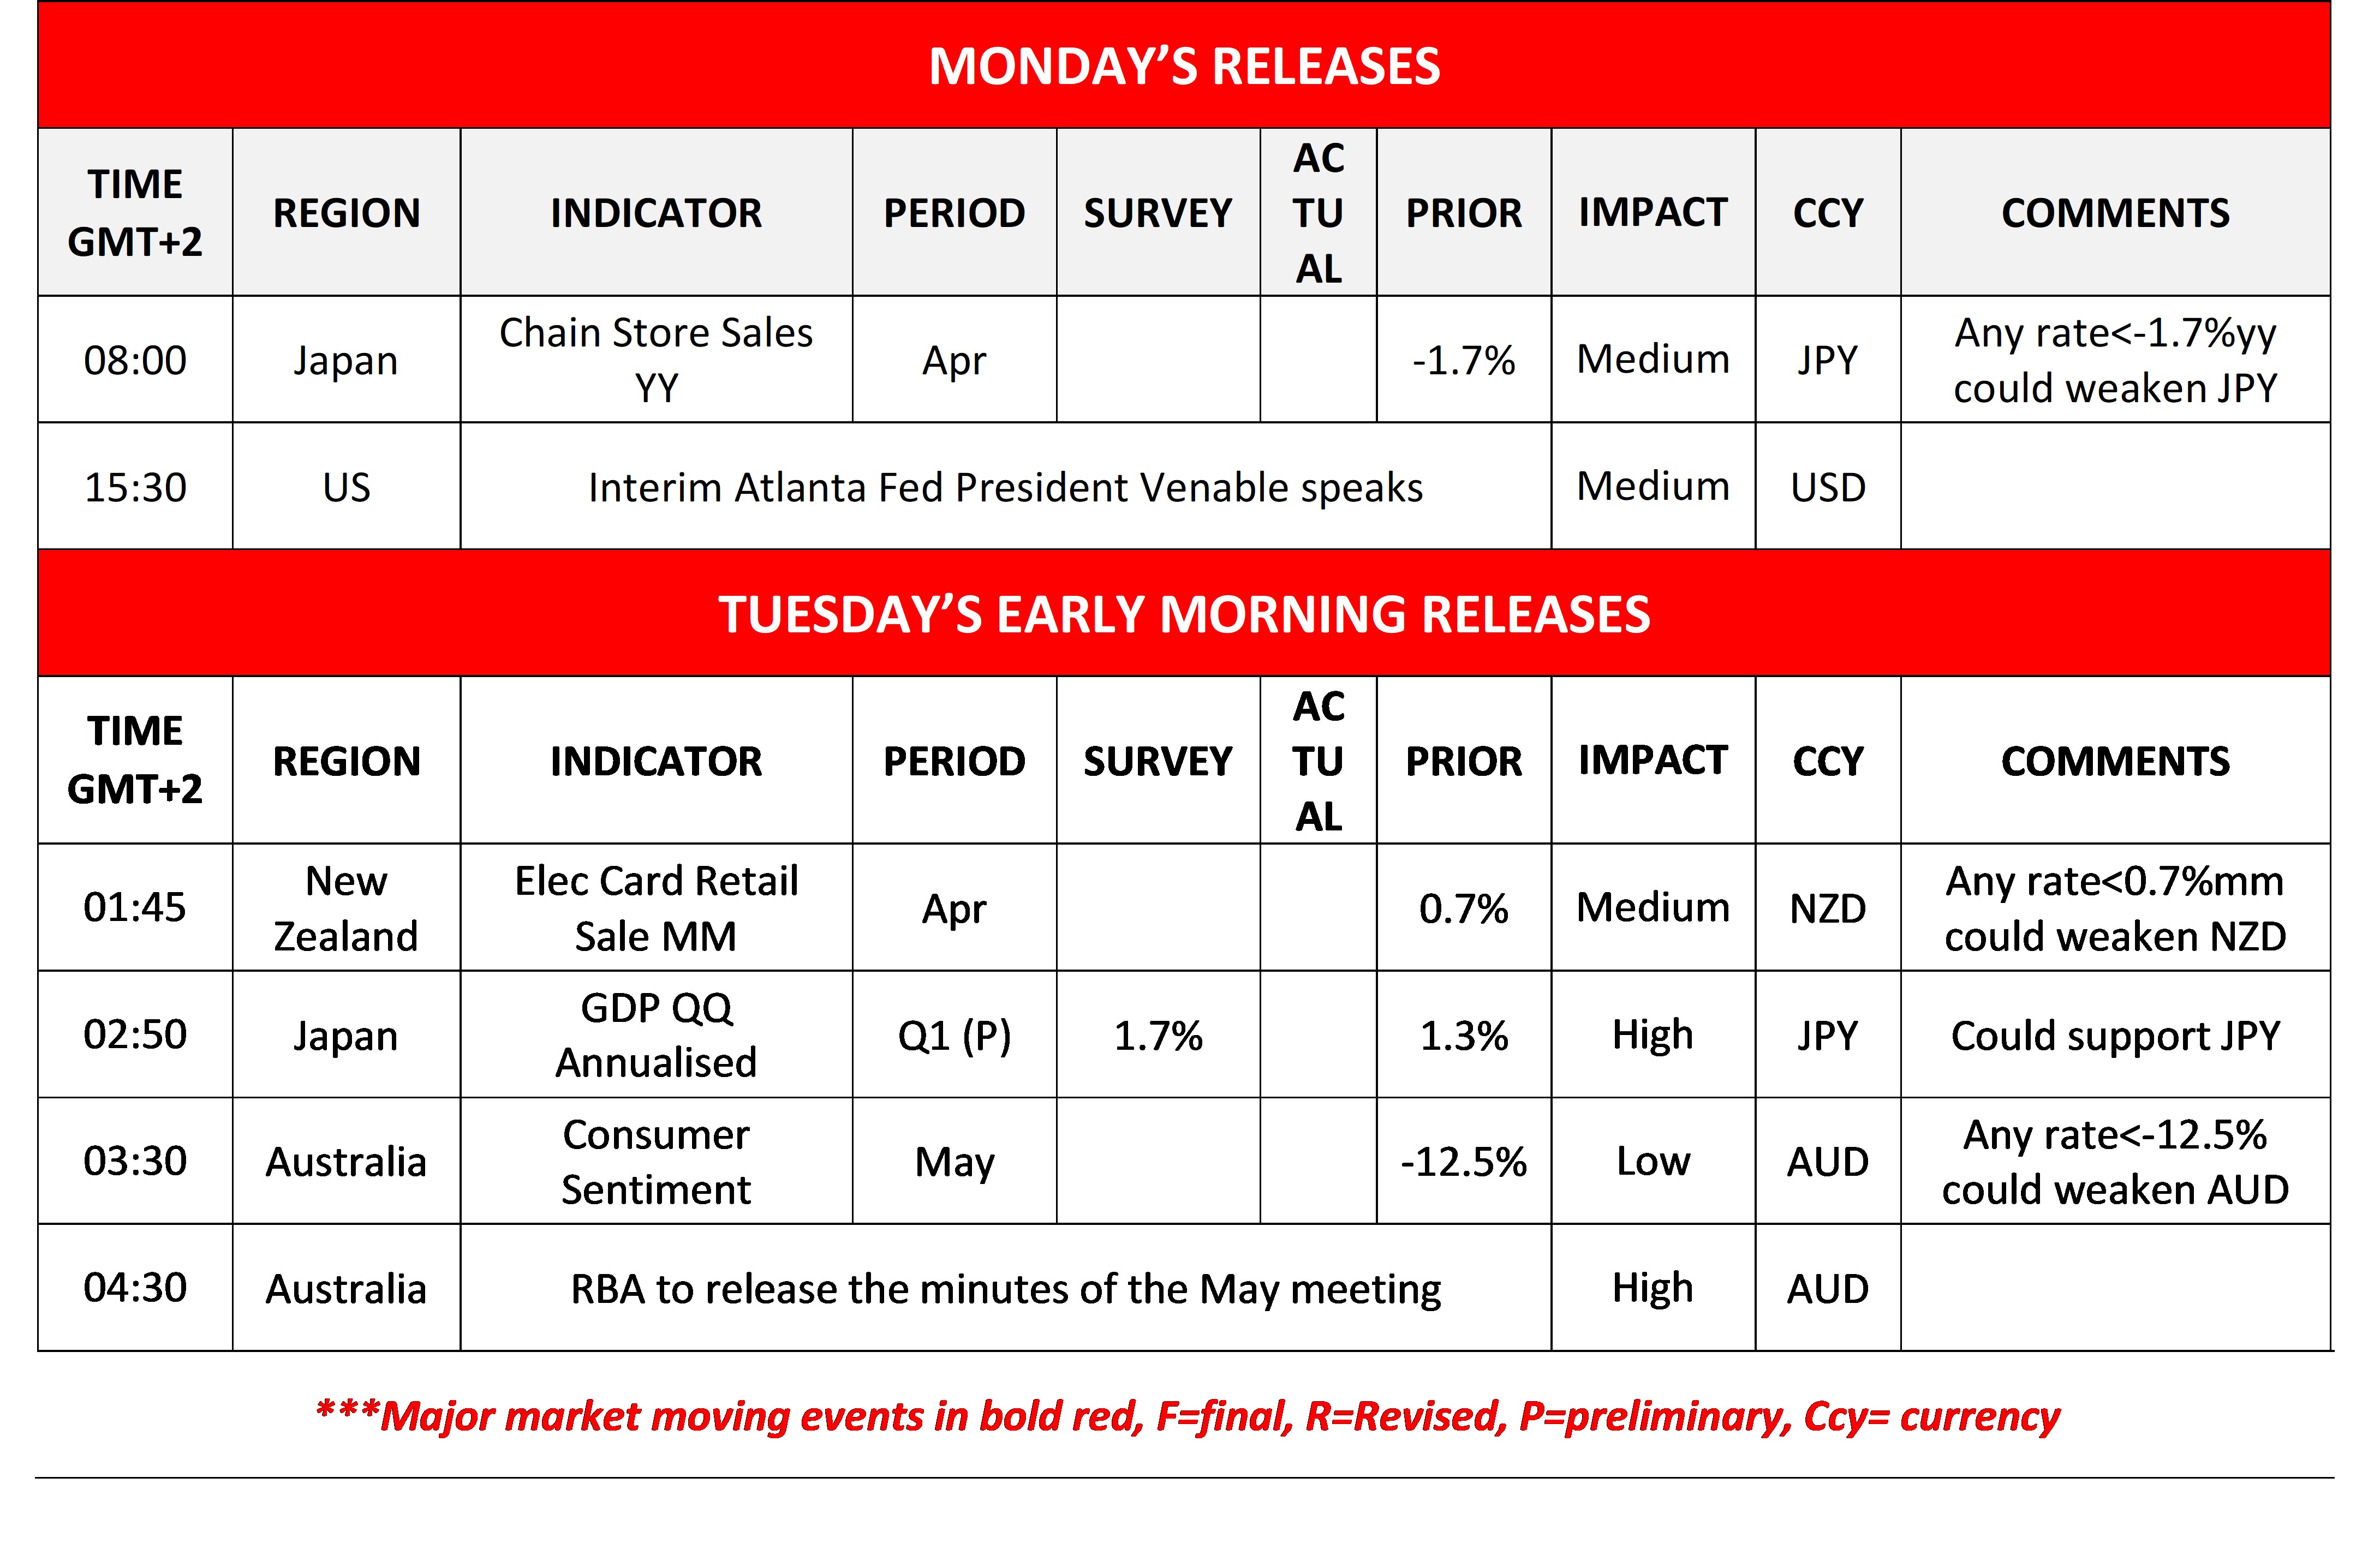
The USD edged lower against its counterparts in the FX market during today’s Asian session, despite tensions in the Middle East being on the rise, enhancing market worries, Bonds selling off on a global level, and US inflation worries being ever-present. Elsewhere in the FX market, yen weakness remains obvious, sparking fears for a possible market intervention by Japan. Also, JPY traders may keep a close eye on the release of Japan’s GDP rate for Q1. Furthermore, in Australia, RBA is to release the minutes of its last meeting.
US stock markets continue to lose ground
US stock markets continued to lose ground in today’s Asian session as the market sentiment turned more cautious on Friday, given worries for inflationary pressures and high oil prices. SpaceX’s much-discussed IPO is nearing as the company accelerates the IPO timeline, now targeting June 12 for listing on Nasdaq. Also, we highlight NVIDIA’s earnings release on Wednesday.
Oil jumps as military options are put on the table
Oil prices continued to rise during today’s Asian session, as the negotiations between the US and Iran seem to be stalling. Tensions have escalated further, as the UAE reported an attack on a nuclear power plant and the US are reportedly, putting military options for Iran once again on the table. US President Trump stated that the “clock is ticking“…
دیگر نکات مهم امروز
Today, Interim Atlanta Fed President Venable speaks. In tomorrow’s Asian session, Australia’s consumer Sentiment for May, while RBA is to release the minutes of the May meeting.
در مورد بقیه هفته
Tomorrow, we get UK’s employment data for March and Canada’s CPI rates for April. On Wednesday, we get UK’s CPI rates and Euro Zone’s HICP rate both for April and the Fed’s April meeting minutes. On Thursday, we get New Zealand’s trade data for April, Australia’s, Japan’s, the Euro Zone’s the UK’s and the US’s preliminary PMI figures, UK’s CBI trends, Canada’s business barometer, the US Phille Fed Index and Euro Zone’s Consumer Confidence, all for May and from the US the initial jobless claims. On Friday we get Japan’s CPI rates for April, UK’s retail sales for April, Germany’s Ifo indicators for May and Canada’s March retail sales.
Charts to keep an eye out
WTI
WTI’s price continued to rise on Friday and during today’s Asian session, teasing the 107.00 (R1) resistance line. We continued to maintain a bullish outlook for WTI’s price, given also that the upward trendline guiding it remains intact and the RSI indicator has started to rise above the reading of 50, implying a bullish predisposition of the market for WTI. Should the bulls continue to lead WTI’s price action, we may see it breaking the 107.00 (R1) resistance line and start aiming for the 112.70 (R2) resistance level. Should the bears take over, we may see WTI’s price aiming if not breaching the 100.90 (S1) support line and we set as the next possible target for the bears the 93.80 (S2) support level.
Nasdaq
Nasdaq’s price dropped on Friday and during today’s Asian session, aiming for the 28750 (S1) support line. In its downward motion Nasdaq’s price action has broken the upward trendline guiding it, thus signaling an interruption of the Index’s upward motion. We temporarily switch our bullish outlook in favour of a sideways motion bias, yet note that bullish tendencies may still be present. Should the bulls regain control over Nasdaq’s direction, we may see it reversing course and breaking the 30000 (R1) resistance line. Should the bears take over, we may see Nasdaq’s direction breaking the 28750 (S1) support line and setting in its sights the 27500 (S2) support level.
WTI Daily Chart
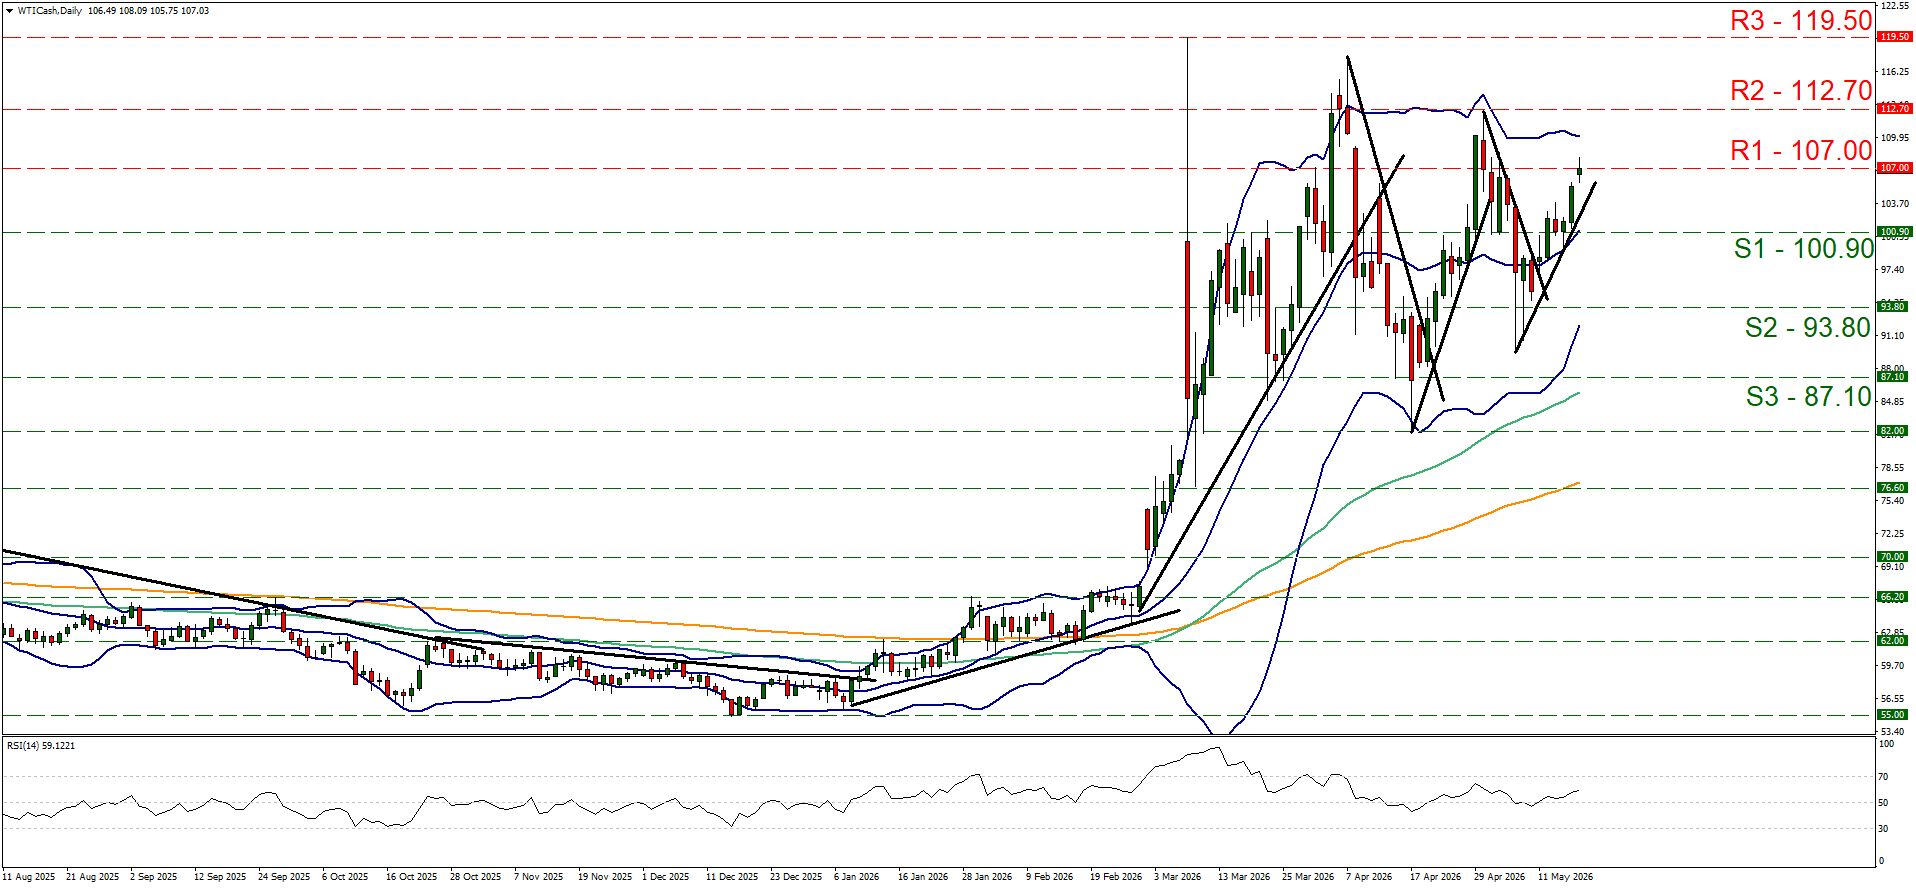
- Support: 100.90 (S1), 93.80 (S2), 87.10 (S3)
- Resistance: 107.00 (R1), 112.70 (R2), 119.50 (R3)
نمودار چهار ساعته شاخص سهام نزدک
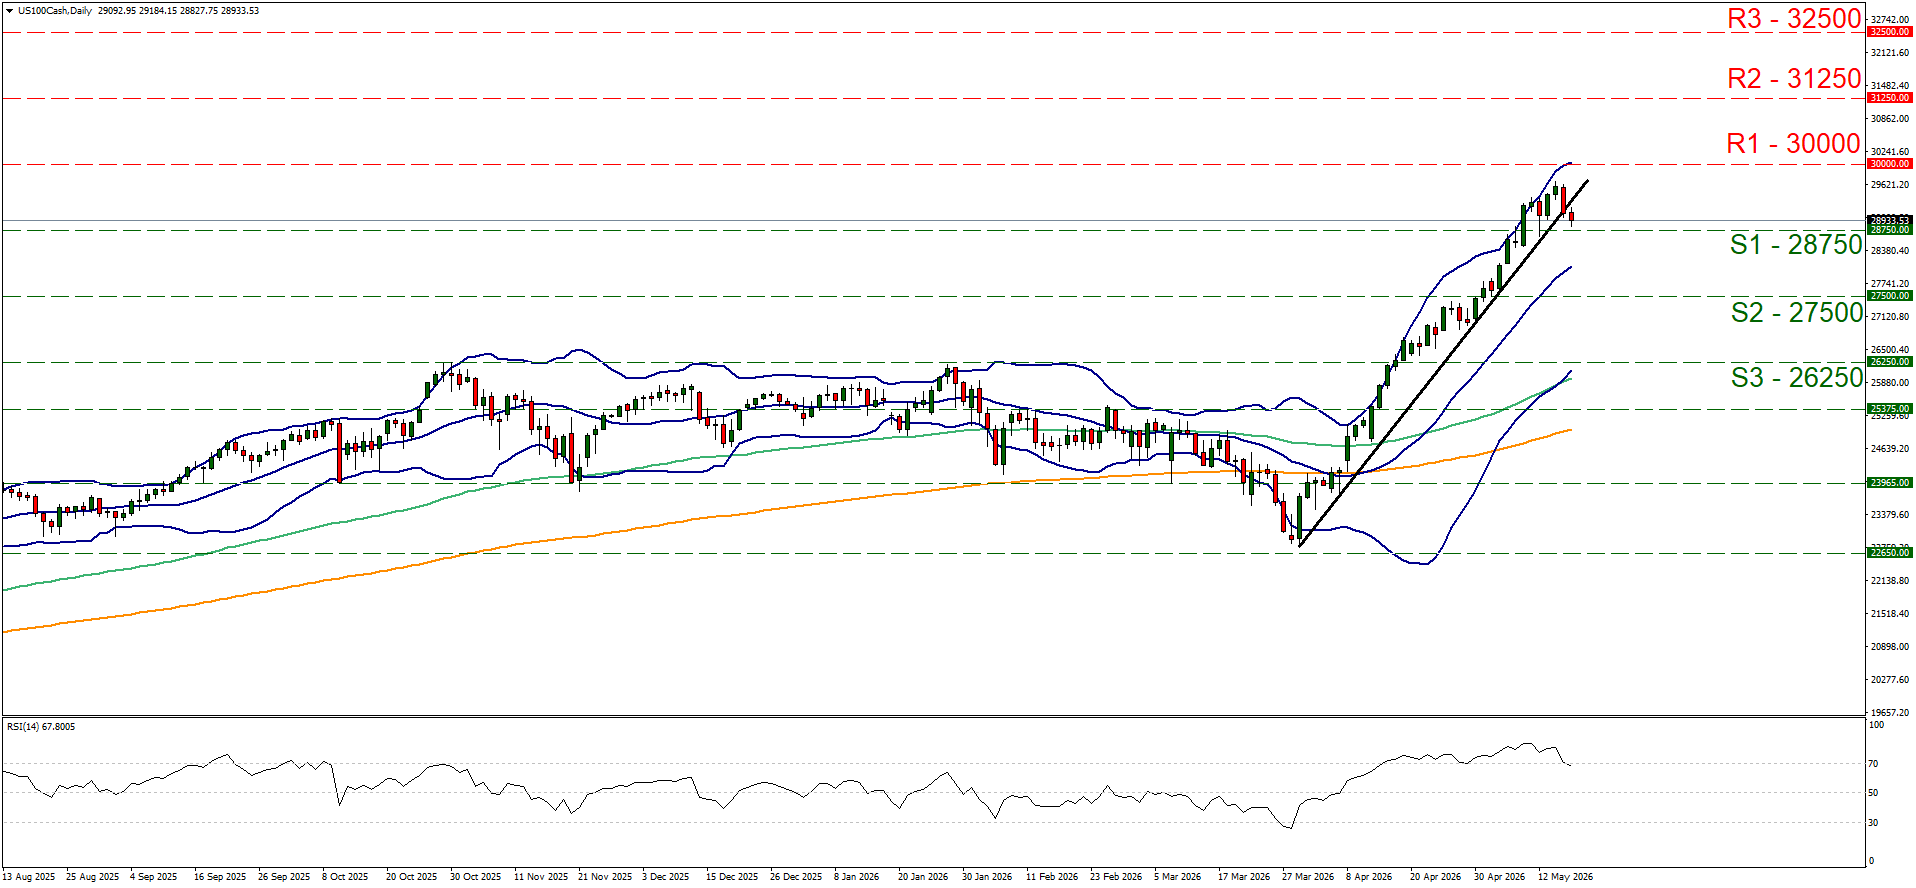
- Support: 28750 (S1), 27500 (S2), 26250 (S3)
- Resistance: 30000 (R1), 31250 (R2), 32500 (R3)
سلب مسئولیت:
این اطلاعات به عنوان مشاوره سرمایه گذاری یا توصیه سرمایه گذاری در نظر گرفته نمی شود ، بلکه در عوض یک ارتباط بازاریابی است. IronFX هیچ گونه مسئولیتی در قبال داده ها یا اطلاعاتی که توسط اشخاص ثالث در این ارتباطات ارجاع و یا پیوند داده شده اند ندارد.