
WTI is on track to finish its second consecutive week in the reds and trades near levels once seen before at the start of the month. Crude prices have been under pressure mainly from Russia’s output 和 export cuts announcement, alongside weakening demand for oil across the US evident from another large buildup in API inventories over the past week. Keeping crude prices afloat has been the renewed optimism surrounding China’s reopening alongside upgraded forecasts by IEA and OPEC in regards to global growth demand for 2023. In this report we aim to shed light on the catalysts driving WTI’s price, assess its future outlook and conclude with a technical analysis.
Russia seen ramping up output cuts
Last week a report from Reuters pointed out that Russia will cut its crude production by 500 thousand barrels per day in March, accounting for approximately 5% of its output, as a response to the West imposing a price cap on Russian oil and oil related products. The G7, the European Union and Australia agreed to ban the use of Western-supplied maritime insurance, finance and brokering for seaborne Russian oil priced above $60 per barrel. Earlier today, another Reuters report indicated that Russia plans to cut oil exports towards western ports by up to 25% in March and it’s in essence attempting to revamp its output cuts in to bump up its own crude prices. Russia has so far managed to re-route exports towards the east after the European Union’s sanctions and the G7’s price cap, primarily targeting India and China who are expected to dominate global growth expectations this year. Last week the International Energy Agency raised its expectations for global oil demand in 2023 to 2 million barrels per day (bpd), with the rise being of about 100k bpd. The rise seems to be related to the reopening of China, and its characteristic, that IEA was reported stating that “The risk-averse climate of recent months subsided on optimism that China’s reopening would bolster global growth. Adding to the more upbeat mood was a distinct improvement in Europe’s economic outlook, buttressed by the spectacular slump in natural gas prices”.
API records second straight week of build ups, EIA data incoming
Yesterday, the weekly API crude oil inventories report pointed out a buildup of almost 10 million barrels in stocks, exceeding expectation for a mere increase of 1.2 million. The results represent the second straight week of large inventory buildups and could be one of the reasons that dragged WTI price lower during yesterday’s session. Later today, the updated record from EIA’s weekly crude inventories is due and is expected to capture energy traders’ attention. According to forecasts the market anticipates that EIA’s stocks would increase by 2 million barrels after last week’s blowout 16-million-barrel buildup. Should that be the case that may provide some support for WTI, however we must point out that the inventory figure may end up being much higher than expectations, if we draw inferences from yesterday’s API release. Nevertheless, we must note that currently EIA’s inventories have been piling up for the past 8 weeks which signals consistent weakened demand for crude and increases the probabilities for the extension of WTI prices towards the downside. Lastly, we would note that last Friday the Baker Hughes oil rig count showed that the number of active oil rigs in the US has dropped by a count of 2 reaching a total of 607, which could serve as another clear indication for a slowdown in demand.
技术分析
BRENTCash Daily
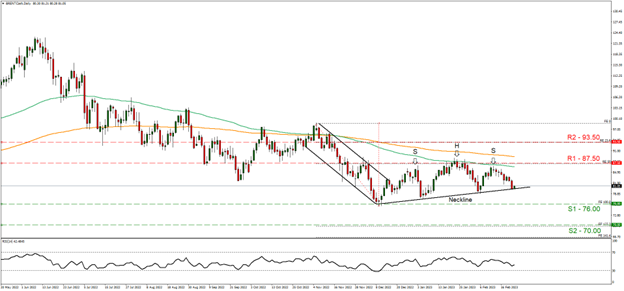
- Support: 76.00 (S1), 70.00 (S2)
- Resistance: 87.50 (R1), 93.50 (R2)
Looking at BRENTCash Daily chart we observe the possible formation of a head 和 shoulders pattern and currently Brent prices fluctuate close to the neckline. We hold a bearish bias for the extension of the move towards the downside should the price action break definitively below the neckline. Supporting our case is the RSI indicator below the daily chart which registers a reading of 40, showcasing slight bearish tendencies surrounding the commodity. Should the bears reign, we may see Brent price break below the 76.00 (S1) support level and extend their fall towards the 70.00 (S2) support base. Should on the other hand, the bulls take over, we may see the commodity bouncing from the neckline, rise and break the 87.50 (R1) resistance level and head closer to the 93.50 (R2) resistance barrier.
如果您对本文有任何常规疑问或意见,请直接发送电子邮件至我们的研究团队,地址为 research_team@ironfx.com
免责声明:
本信息不被视为投资建议或投资推荐, 而是一种营销传播. IronFX 对本信息中引用或超链接的第三方提供的任何数据或信息概不负责.


