
Crude oill is currently on track to record its third straight week in the greens, further distancing itself from its 15-month lows. Contributing to this week’s impressive gains was the surprise announcement of OPEC+ to cut output production, as the cartel detected a deviation in market fundamentals and the price of crude and decided to intervene to restore stability. In this report, we aim to shed light on the catalysts driving WTI’s price, assess its future outlook and conclude with a technical analysis.
OPEC+ strikes again
Energy traders were quick on their feet during the early hours of the Asian trading session on Monday, recalibrating their positions to reflect the surprise announcement of OPEC+ the day before. As a result WTI prices spiked by nearly 7% from Friday’s close to the $81 per barrel and managed to consolidate its gains, holding steady around this range ever since. The oil cartel caught everyone off guard, once again, this past Sunday as it broadcasted to the world its unyielding commitment at intervening and rebalancing the market whenever a so called “deviation” occurs. During an unofficial ministerial meeting, the organization announced 1.16 million barrels of output cuts, set to take place in May and will last for the remainder of the year. The voluntary cuts by OPEC+ attracted criticism from Western nations, more specifically the US, whose envoys outright branded the decision as ill-advised, expressing forthright their disagreement with the decision. Even thought the US and Saudi Arabia, the leader of the oil cartel, share a strategic trade alliance the US does not have an implicit say into how the kingdom does business. John Kirby, coordinator for strategic communications at the National Security Council of the United States held a media briefing to discuss the incident and stated that “we’re not always going to agree…with everything that Saudi Arabia does or says any more than they’re always going to agree with everything that we do or say, but that doesn’t take away from the fact that it is a strategic partnership”, attempting in a sense to contain escalating tensions. The relationship of the two nations have grown bitter over the past year, following the decision of the Saudis to cut oil production by 2-million-barrel last October. To conclude, the event constitutes as a bullish catalyst for oil prices in the short term, since a reduction in supply by OPEC alongside the slacking demand for crude from China since its reopening, pushes traders to upwardly revise their outlooks.
API and EIA report depleted stockpiles for the second straight week
Last week crude oil inventories in the US recorded their second consecutive week of drawdowns, possibly signaling a shift in demand for domestic consumption. On Tuesday the weekly API crude oil inventories reported a 4.3-million-barrel drawdown, higher than the expectation 1.8 million barrels, while yesterday EIA’s weekly oil inventories recorded a similar drawdown of a 3.7-million-barrels of crude, again higher than the 2.3-million-barrel drawdown expectation for the same period. Even though the results may provide confidence in the eyes of energy traders with bullish outlooks, there was no substantial reaction to the release. WTI has been trading in a tight range around the $80 since the start of the week and currently appears to be in consolidation mode, with neither the bulls nor the bears taking the initiative. Lastly, we would like to point out that last Friday the Baker Hughes oil rig count report showed that the number of active oil rigs in the US, decreased by a count of 1 reaching a total of 592, which serves as an indication of slight slowdown in demand over the past week.
技术分析
WTICash 4H Chart
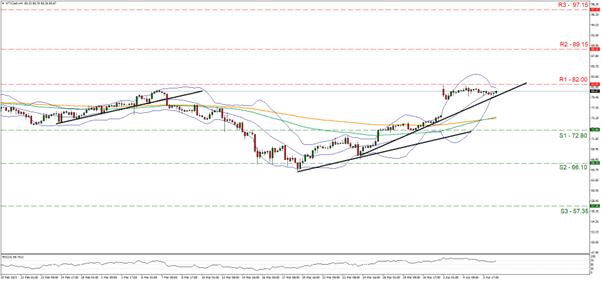
- Support: 72.80 (S1), 66.10 (S2), 57.35 (S3)
- Resistance: 82.00 (R1), 89.15 (R2), 97.15 (R3)
WTI’s price remained relatively unchanged after the jump on Monday’s opening, just below the 82.00 (R1) resistance line. The commodity’s price seems to be nearing a make-a-break position as it seems to have hit a ceiling at the R1, yet on the other hand, has reached an upward trendline with its origins back in the 24th of March. We noted that the RSI indicator below our 4-hour chart remains at rather high levels, yet just below the reading of 70, implying a bullish sentiment for the commodity’s price, yet on the flip side the Bollinger bands have narrowed exactly reflecting the low volatility characterizing its movement, which may allow the price action to maintain its sideways motion since the start of the week. For the time being, we tend to expect WTI’s price to maintain its sideways motion and given its current collision course with the prementioned upward trendline, such a scenario would imply that the price action would break it. We recognize thought the bullish sentiment yet for a clearcut bullish outlook we would require the commodity’s price to break the 82.00 (R1) resistance line, that exactly served as an upper boundary for its recent sideways motion but also was tested on multiple occasions from the beginning of December 2022 until today and for it to start aiming if not reaching the 89.15 (R2) resistance line, after a series of consecutive higher peaks and troughs, a level not seen any price action since mid-November last year. Should the bears take over, we may see WTI’s price diving lower, breaking the prementioned upward trendline, signaling the end of the upward movement, yet for a bearish outlook we would also require the pair to break the 72.80 (S1) support line that served the WTI’s price as the lower boundary of its past sideways motion from the 1st of December 2021, until the 14th of March. Such a scenario would practically open the gates for the commodity’s price to aim for the 66.10 (S2) support level which hasn’t been activated since December 2021. Such a movement would allow us also to draw possibly a downward trendline showing us the limitations of the downward movement of the commodity’s price.
如果您对本文有任何常规疑问或意见,请直接发送电子邮件至我们的研究团队,地址为 research_team@ironfx.com
免责声明:
This information is not considered investment advice or an investment recommendation, but instead a marketing communication. IronFX is not responsible for any data or information provided by third parties referenced or hyperlinked, in this communication.


