


Channel MT4 indicators are a group of technical tools that traders use to visualise price action within defined boundaries or “channels”.
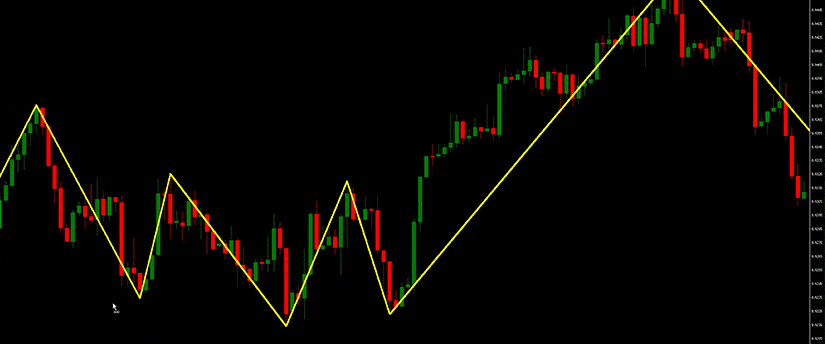
A channel occurs when an asset’s price moves between two parallel trendlines. The channel is comprised of a middle line (e.g. a moving average) and two boundary lines (trendlines) on top of and underneath the middle line.
The boundary lines are normally indicative of price extemes and usually based on volatility. The upper trendline or boundary line connects the swing highs in price.
Adversely, the lower trendline connects the swing lows. The channel moves in varied directions on the chart, be this upward, downward, or sidewards.
Should the asset’s price break out of a trading channel in an upward direction, it may suggest that the price will continue to rally. Conversely, if the price breaks below the lower boundary of the channel, it could signal that more selling pressure is imminent.
Channel MT4 indicators assist traders to identify breakout opportunities, reversals, and also continuation patterns. A variety of channel indicators exist, three of the most popular being Bollinger Bands, Donchian Channels, and the Keltner Channel.
1. Bollinger Bands – MT4 indicator
MetaTrader 4’s (MT4) Bollinger Bands are probably one of the platform’s most renowned channel indicators. The tool was developed by John Bollinger in 1980 to help traders gauge market volatility and to identify entry and exit points, and has become a staple in technical analysis ever since.
They appear on a chart as three lines that move with the price. In the context of the value of a stock’s price, the centre line is the stock’s price simple moving average (SMA), with the upper and lower bands based on the standard deviation of the price (usually two standard deviations).
The bands typically widen when the stock’s price becomes more volatile and narrow when price volatility eases. The latter is known as a “squeeze”.
Bollinger Bands can also be used to establish when an asset is overbought and oversold. When the price touches the upper band, it may suggest overbought conditions, and when it touches the lower band, it could indicate oversold conditions.
False signals can however still occur, particularly during extreme market conditions, so combining Bollinger Bands with other technical tools and implementing effective risk management is vital.
2. Keltner Channels
Instead of standard deviation as in the case of Bollinger Bands, Kelter Channels use Average True Range (ATR) to calculate the channel’s width. Developed by Chester Keltner in his 1960 book “How to Make Money in Commodities”, Keltner Channels are volatility based bands placed on either side of an asset’s price and may assist in establishing a trend’s direction. Breaks above or below the top and bottom barriers indicate a continuation.
As far as mean reversion and breakout detection is concerned, the middle line often acts as a dynamic support/resistance zone. Traders can look for reversals close to the upper or lower band or anticipate breakouts when the price closes outside the channel.
On occasion, advanced traders may choose to combine Keltner Channels with momentum oscillators like the MACD to establish trend strength or potential reversals.
A trader using the Keltner Channel strategy will consider executing a long position (and exiting short positions) when the price action breaks above the band. In contrast, they may execute a short position when the price action breaks below the band (simultaneously exiting long positions).
While Keltner Channels may be less effective in range-bound markets, they are good for providing clearer signals in trending markets. They are also less susceptible to noise than Bollinger Bands, but slower to react in sudden market volatility.
3. Donchian Channels
While not as popular as Bollinger Bands of Keltner Channels, Donchian Channels are still a highly effective channel indicator. They seek to identify market volatility (bullish and bearish), potential for price breakouts (higher and lower), and the right time to enter or exit a position.
Donchian Channels are particularly popular for their effectiveness in identifying breakouts, with the upper band signalling the highest price over a specific period and the lower band the lowest price.
They are also great for capturing robust price trends as they form, and are highly effective in filtering out noise and focusing on price extremes. Like Bollinger Bands however, they can produce false signals in volatile markets so risk management is important.
Why MetaTrader 4?
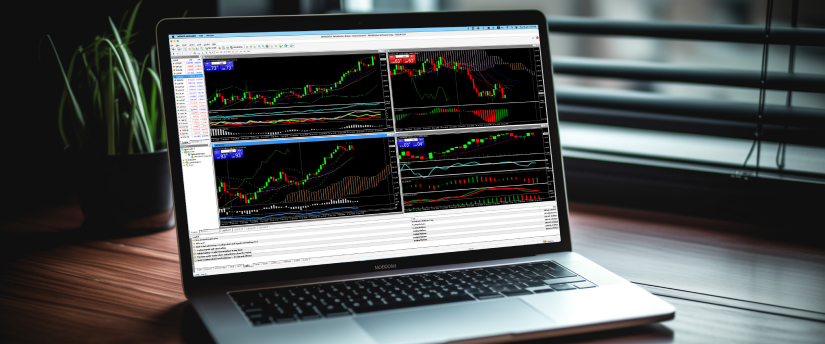
The MetaTrader 4 platform is one of the most widely used trading systems across the globe. It has garnered widespread appeal largely for its innovative features and ease of use.
One of its most endearing aspects is the high quality and robustness of its technical analysis tools. These include 30 built-in indicators, 2k+ free custom MT4 indicators and 700 paid ones, giving a trader the ability to analyse any market, no matter how complex.
In addition, MT4 offers 24 analytical objects like channels, lines, shapes, arrows, and also Gann and Fibonacci tools. This enables the trader to forecast future price dynamics (direction, trends, support/resistance levels, etc).
Risk Management Techniques with MT4 Indicator to Safeguard Your Funds
There are many ways for a trader to reduce the risk of large losses, regardless of the channel MT4 indicators they decide to use. The most popular risk management techniques that traders tend to use are stop-loss orders and take-profit orders.
Stop-loss orders are triggered to limit losses when an asset reaches a certain price, and the market appears to move in an undesirable direction.
Take-profit orders are triggered capture profits when a pre-established price level is reached. In addition to these two orders, traders will also likely use position sizing, never risking more than a particular amount on a single trade, as well as portfolio diversification so that risk is spread across multiple assets.
Other more nuanced methods of risk management include developing a trading plan that provides a structured framework for trading.
This trading plan typically defines the rules for your trading decisions, and the level of risk you won’t exceed, both of which will keep you better focused and more disciplined.
The plan will also include your budget for trading, to ensure you don’t exceed it, potentially losing funds otherwise reserved for important life expenses, like a pension fund, university fund, health insurance, etc.
A trading plan also goes a long way in mitigating the risk of feelings influencing trading decisions. Emotive trading is inherently risky as it’s usually based on emotions like fear, stress, greed or anxiety, which generally leads to poor decision making and even poorer trading outcomes.
By sticking to a plan instead, you’re likely to be making decisions based on objective data and technical analysis, which have a higher potential for success.
Finally, although not a risk management tool in itself, ongoing learning is certainly a technique that will reduce the risk of making mistakes. By engaging in continuous education to improve your knowledge about trading, i.e., strategies, 技術分析, the financial markets and the factors that impact them, price trends, etc, your trading decisions will as a result be better informed too.

Use MT4 indicator with IronFX
Register with award-winning IronFX and enjoy a high-quality, flexible trading experience, a range of tradable assets, multiple account types, and quick and easy trade execution.
You’ll also be able to enjoy fast withdrawals and deposits, and market access via the MetaTrader 4 (MT4) trading platform, arguably one of the world’s most popular trading systems amongst global traders.
The IronFX Academy also offers an abundant source of educational resources to boost one’s skills and acquire fundamental trading insights.
免责声明: 本信息不被视为投资建议或投资推荐, 而是一种营销传播. IronFX 对本信息中引用或超链接的第三方提供的任何数据或信息概不负责.


