
黄金 extended its declines over the past week as the dollar found renewed support from the hotter-than-anticipated core PCE data which reinforced the narrative that the US central bank will need to adopt a more restrictive monetary policy stance to contain inflation from becoming deeply ingrained within the US economy. This report aims to shed light on the catalysts driving the precious metal’s price, assess its future outlook and conclude with a technical analysis.
Hotter-than-expected PCE print fuels bets for more aggressive tightening
Last Friday, the Fed’s favourite inflation metric, the core PCE index came out hotter than expected and restoked fears that the central bank will be forced to hike rates more than originally forecasted. More specifically, the year-on-year Core PCE index which excludes volatile fuel and food costs, rose to 4.7% in January, higher than the market’s consensus, which expected a slowdown to the 4.3% level, but was also higher than the 4.6% reading of the prior month. The PCE index was also sharply higher to 5.4% beating estimates for a slowdown to 5%. The results practically validated the concerns of the committee that inflationary pressures are not abating fast enough and their stickier nature may pose as a structural systemic risk if not addressed properly with more rate increases. As a result, the market had to downplay their overoptimistic speculative bets for a Fed pivot and readjust their forecasts, evident from the apparent strength in the USD on Friday.
Gold, on the other hand, fell sharply lower, extending its weeks-long fall, since higher borrowing costs for a prolonged period of time, inadvertently increase the opportunity cost of holding the non-interest-bearing bullion. Adding more fuel to the fire, the results of the US personal spending metric added more confidence in the Fed’s case for a tighter monetary policy going forward, since an uptick to the 1.8% level was recorded. Pair that with a stubbornly robust employment market that has yet to show any cracks and the probabilities for a more restrictive stance by Fed increase substantially. Validating the view for a harsher Fed in the future were the comments from Cleveland Fed President Loretta Mester who stated in a speech post the PCE result that “it’s going to take more effort on the part of the Fed to get inflation on that sustainable downward path to 2%.” Moreover, yesterday, Fed Governor Jefferson commented on the elevated core PCE index results of Friday and stated that “I’m under no illusion that it’s going to be easy to get the inflation rate back down to 2%,” and added, “there’s a lot of resolve on the part of the Committee. I know that I am committed to doing what it takes”, signalling to the market to brace for more.
FOMC meeting minutes signal more hikes inbound
Last week’s release of the latest Fed meeting minutes pointed out the unanimous resolve of the committee to raise rates further yet at a slower pace. At the same time, the members acknowledged the upside risks of inflation becoming deeply entrenched in the US economy and noted that inflation remains the key factor that shapes the central bank’s policy outlook. Furthermore, the importance of deciding on how large the upcoming interest rate increases will be depended on incoming data and should there be a reignition of inflationary pressures as we move further into 2023, there might be a readjustment of the projected terminal rate. That inadvertently could lead to dots moving higher on the dot plot graph, expected at the March meeting and analysts foresee that we may see the projected median being pushed higher to 5.6%, meaning another 25-basis points hike may be due. According to December’s dot plot graph, the central bank forecasted a 5.1% median target rate, a projection that might be revised higher should inflationary pressures fail to ease or fail to maintain the Fed’s projected path towards the 2% level. Currently, the Feds Funds Futures assign a 77% probability for a 25-basis points rate hike in the March meeting, alongside another two 25 basis points increases in May and June, respectively, with a 5.25-5.5% serving as the target rate in the eyes of the market. Should incoming data validate the view that more hikes are needed to curb inflationary pressures we may see the dollar receive further inflows and as a result see gold coming under pressure since the prospects for tighter financial conditions dampen the appeal of the shiny metal in the eyes of investors.
技术分析
黄金/美元4小时走势图
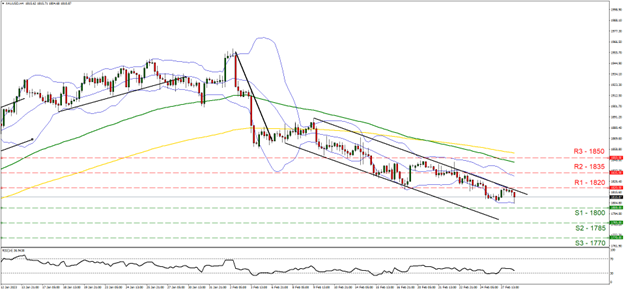
- Support: 1800 (S1), 1785 (S2), 1770 (S3)
- Resistance: 1820 (R1), 1835 (R2), 1850 (R3)
Looking at XAUUSD 4-hour chart we observe that gold has been on the retreat since the start of February pressured by a series of better-than-expected US economic data that lifted the dollar at the expense of the precious. We hold a bearish outlook bias given that the price action remains confined within the bounds of the descending channel, forming lower highs and lower troughs as gold travels to lower ground. Supporting our case is the RSI indicator below our 4-hour chart currently registers a value of 34, showcasing the bearish tendencies surrounding the precious. Should the bears reign over, we may see the price action break below the $1800 (S1) support level and move lower closer to the $1785 (S2) support base. Should the bulls take over, we may see the break above the $1820 (R1) resistance level and move closer to the $1835 (R2) resistance barrier.
免责声明:
This information is not considered investment advice or an investment recommendation, but instead a marketing communication. IronFX is not responsible for any data or information provided by third parties referenced or hyperlinked, in this communication.


