

The downward motion of Oil prices seems to have been interrupted yet the situation tends to remain fluid since our last report. Fundamentals related to the international oil market tend to be intense. In today’s report, we are to have a look at the data relating to the US oil market and continue to view the fundamentals affecting the demand side of the international oil market. To conclude the report we will also provide a technical analysis of WTI’s daily chart.
Mixed signals from the US oil market
There were some mixed signals regarding the US oil market over the past week. Starting with the Baker Hughes oil rig count, the indicator’s reading last Friday, showed that the number of active oil rigs in the US remained unchanged at 483.
The release tended to imply the lack of need for US oil producers to activate additional oil rigs to pump out more oil and could imply a stagnation of oil demand in the US oil market, which could be interpreted as somewhat bearish for oil prices.
On Tuesday, we would note the release of the API weekly crude oil inventories figure. The indicator’s reading was expected to show an increase of US oil inventories, yet that was not the case. The release showed that there was another drawdown of -2.7 million barrels, yet narrower than last week’s reading of -7.4 million barrels.
The release tended to imply that demand in the US oil market surpassed production levels thus allowing for the notion that the US market remains tight. The picture changed though on Wednesday as the EIA reported a slight increase of US inventories, by 833k barrels, implying that the tightness of the US oil market eased somewhat.
Overall, should the signals in the coming week become clearer, possibly showing a tightening of the US oil market we may see oil prices getting some support.
Market worries for Hurricane remain
On a fundamental level, we note that the south east of the US have been hit by hurricane Francine, now classified as a tropical storm. The tropical storm has hit Luisiana and is now turning northwards towards Mississippi.
Heavy rain is now impacting a broad area, while a tornado watch is in effect for southern Alabama and the western Florida. It should be noted that wide areas have been flooded, while hundreds of thousands of homes and businesses experienced power cuts.
The tropical storm is enhancing market worries for the possibility of a contraction of oil production levels in the US which in turn could support oil prices. On the other hand should market worries for the effects of the tropical storm starting to ease, we may see an adverse effect on oil prices.
Oil demand expectations ease
As for demand levels in the international market, the outlook is not so positive. OPEC has lowered its global demand growth expectations for 2024 and 2025. As per Reuters, On Tuesday,OPEC in a monthly report said world oil demand will rise by 2.03 million barrels per day (bpd) in 2024, down from growth of 2.11 million bpd expected last month.
Until last month, OPEC had kept the forecast unchanged since it was first made in July 2023. Yet we note that such forecasts could serve as a justification of the oil producing cartel’s low production levels and thus may force OPEC and its allies to keep the production quotas for each member at low levels, if not lower theme even further.
Similarly also IEA cut its 2024 demand growth forecast, also as per Reuters. The International Energy Agency (IEA) has cut its 2024 oil demand growth forecast by 70,000 barrels per day (bpd), or about 7.2%, to 900,000 bpd, it said in its monthly oil market report.
The Agency in its monthly report, cited that the chief driver of this downturn is a rapidly slowing China, where consumption contracted y-o-y for a fourth straight month in July, by 280 k bpd. Overall we note that the lowering of the oil demand outlook could weigh on oil prices.
It should be noted that the August manufacturing PMI figures tended to imply that Chinese factories are still struggling to keep economic activity afloat, which may enhance market worries for oil consumption in China and thus weigh on oil prices. Please note that similar signals were send for economic activity in the US manufacturing sector in the past month.
技术分析
WTICash Daily Chart
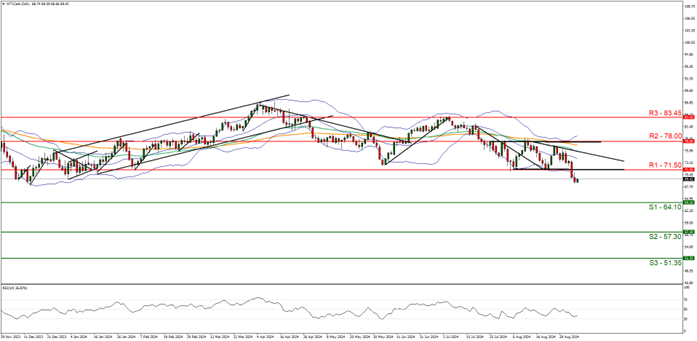
Support: Support: 64.70 (S1), 61.50 (S2), 57.20 (S3)
Resistance: Resistance: 68.00 (R1), 71.15 (R2), 75.50 (R3)
WTI’s price edged higher yesterday, bouncing on the 64.70 (S1) support line. We note that the commodity’s price in its upward motion during today’s Asian session, seems to have broken the downward trendline guiding the commodity’s price action since the 30 of August, hence we tend to switch our bearish outlook in favour of a sideways motion for the time being, as the downward motion of black gold’s price action has been interrupted.
Yet the RSI indicator despite edging higher, remains close to the reading of 30, implying the presence of a bearish predisposition of the market for the commodity’s price action.
Also we note that the price action of the commodity rose after hitting the lower Bollinger band. For a bullish outlook we would require WTI’s price action to break the 68.00 (R1) resistance line and start aiming for the 71.15 (R2) resistance level. On the flip side should the bears be able to regain the initiative over WTI’s price action, we may see it breaking the 64.70 (S1) support line and aiming for the 61.50 (S2) support level.
免责声明:
This information is not considered investment advice or an investment recommendation, but instead a marketing communication. IronFX is not responsible for any data or information provided by third parties referenced or hyperlinked in this communication.


