
Since our last report ,oil prices seem to be hovering above our 66.05 (S1) support level and today we are to discuss the main issues that seem to be tantalizing oil traders currently and conclude the report with a technical analysis of WTI’s daily chart.
US oil market remains loose
The data in the U.S. oil market suggested that relative slack persists. Both the EIA and API weekly crude oil inventories showed a greater-than-expected increase in U.S. crude oil stockpiles.
Specifically, the API figure came in at 4.593 million barrels versus 1.17 million, and the EIA figure came in at 1.745 million barrels which is also higher than the expected figure of 0.8 million barrels.
The API figure came in at 4.593 million barrels, exceeding the expected 1.17 million. The EIA figure was 1.745 million barrels, also higher than the expected 0.8 million.
However, last Friday, the Baker Hughes oil rig count rose from 486 to 487. This may suggest an expected increase in demand.
Nonetheless, if financial releases show that oil production keeps exceeding demand, it could put pressure on oil prices next week.
Geopolitical tensions
The current geopolitical tensions both in the Middle East and in Ukraine may have aided oil prices during the week. Starting with Ukraine and Russia, both nations agreed to avoid targeting energy infrastructure. However, each side accused the other of launching air attacks that caused damage.
The ongoing attacks on energy infrastructure could raise concerns about Russia’s oil supply chain. This, in turn, may have supported oil prices.
In the Middle East, tensions between Israel and Hamas are rising again. On Thursday, the Israeli military announced it had begun ground operations in northern Gaza, effectively ending the ceasefire agreement set in January.
Therefore, the possibility of the conflict leading to a resurgence of regional tensions could aid oil prices. Moreover, the continued strikes by the US against Houthi Rebel’s which could increase the risk of oil tankers traversing through the Red Sea may have also aided oil prices.
Trump Tariff’s and the Fed’s comments
The Fed’s interest rate decision occurred on Wednesday, where the bank kept interest rates steady as was widely expected. Therefore, our attention turned to the bank’s accompanying statement in which the Fed stated that “Uncertainty around the economic outlook has increased”.
Fed ChairPowell stating in his press conference that the uncertainty surrounding the changes and their effects on the economicoutlook is high, when referring to the new administration’s trade policy.
In turn, this may be perceived, as a concern by the Fed that the administration’s trade policies may impact the economy and thus may influence the Fed’s future decisions.
In conclusion, the possibility of the restrictive financial conditions remaining place, could lead to a reduction in economic growth which in turn may decrease demand for oil and could thus may weigh on the commodity’s price.
Oil Technical Analysis
WTI Cash Daily Chart
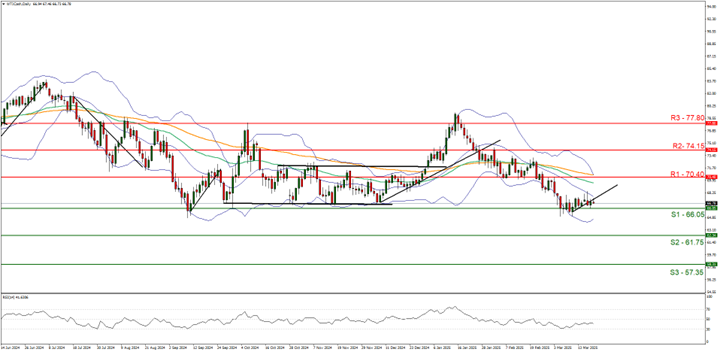
- Support: 66.05 (S1), 61.75 (S2), 57.35 (S3)
- Resistance: 70.40 (R1), 74.15 (R2), 77.80 (R3)
WTI’s price appears to be holding steady above our 66.05 (S1) support level. We opt for a sideways bias for the commodity’s price and supporting our case is the commodity’s failure to clearly break below the 66.05 (S1) support level.
However, the RSI indicator below our chart currently registers a figure near 40, implying that bearish market tendencies remain.
Nonetheless, for our sideways bias to be maintained we would require the commodity’s price to remain confined between the 66.05 (S1) support level and the 70.40 (R1) resistance line.
On the other hand we would immediately switch our sideways bias in favour of a bearish outlook in the event of a clear break below the 66.05 (S1) support level ,with the next possible target for the bears being the 61.75 (S2) support line.
Lastly, for a bullish outlook we would require a clear break above the 70.40 (R1) resistance line with the next possible target for the bulls being the 74.15 (R2) resistance level.
免责声明:
This information is not considered investment advice or an investment recommendation, but instead a marketing communication. IronFX is not responsible for any data or information provided by third parties referenced or hyperlinked in this communication.


