
WTI’s price seems to have interrupted the downward motion it had since the last days of September and left traders guessing about the direction of the next leg of the commodity’s price action. Today, on the fundamental side, we take a look at the situation of the US oil market and then continue to examine the demand side as well as the supply side of oil. The report is to be concluded with a technical analysis of WTI’s daily chart.
Oil: Overview Report
US oil market tightens
In the US, we note that the number of active oil rigs increased by two, reaching 500, according to Baker Hughes last Friday, after a continuous drop of four weeks, in a sign that demand may have risen or at least bottomed out, encouraging oil producers to activate oil wells. It should also be noted that API yesterday reported a far wider drawdown than expected for the past week. API’s reading showed a reduction of US oil reserves by roughly -7.4 million barrels, which tended to take the markets by surprise and provided some support for oil prices shortly after the release. The release tended to highlight the relative tightness of the US WTI market, as it would imply that production levels were not able to catch up with aggregated oil demand in the US. Yet, given the New Year holiday, the release of EIA’s respective reading for the past week’s US oil inventories was postponed for today, and should the reading confirm the downward trajectory of US WTI reserves, we may see WTI’s price gaining as it would also imply a tightness in the US WTI market.
Worries about oil demand maintained
On the demand side of the international oil market, we note that Chinese factories seem to continue to struggle to increase economic activity, given that the Caixin and NBS manufacturing PMI figures for December sent out mixed signals. The news was not positive for the oil market, which needs manufacturing economic activity in China, given its role as one of the largest oil consumers globally, to increase for oil demand to rise. Yet also, the US ISM manufacturing PMI for the same month signaled another contraction of economic activity, albeit to a lesser extent, which was nevertheless another negative signal for oil demand.
OPEC’s intentions, Libya’s oil fields, and the Red Sea
On the supply side of the international oil market, we note OPEC’s intentions to continue the cooperation and dialogue within the wider OPEC+ group. OPEC’s statement was released on Wednesday and relates to the decision of Angola to leave the group, as despite not mentioning Angola per se, it stated that the oil-producing cartel’s members remain united. OPEC plans a meeting on February 1 to review the implementation of the oil production cuts decided in the last meeting.
The production levels mentioned seemed to be rather vague regarding implementation and failed to impress the markets, as we had mentioned in a prior report. We view this meeting as an underscoring of OPEC’s intentions to tighten the supply side of the oil market, and we may see some bullish tendencies building up for oil prices as we near the meeting date. Yet bullish tendencies yesterday and today may have been instigated by market worries for oil supply stemming from the Middle East.
News about an oil field shutting down in Libya amid protests sparked renewed worries among oil traders. It should be noted that the oil field is one of Libya’s largest, with a reported production capacity by Reuters of 300,000 barrels per day. In addition to that, the overall uncertainty caused by increased instability in the region, given the Houthi attacks on vessels navigating through the Red Sea and the terrorist attack in Iran, tended to intensify the worries of oil market participants, leading to higher oil prices.
Oil: Technical Analysis
WTI Cash 4 Hour Chart
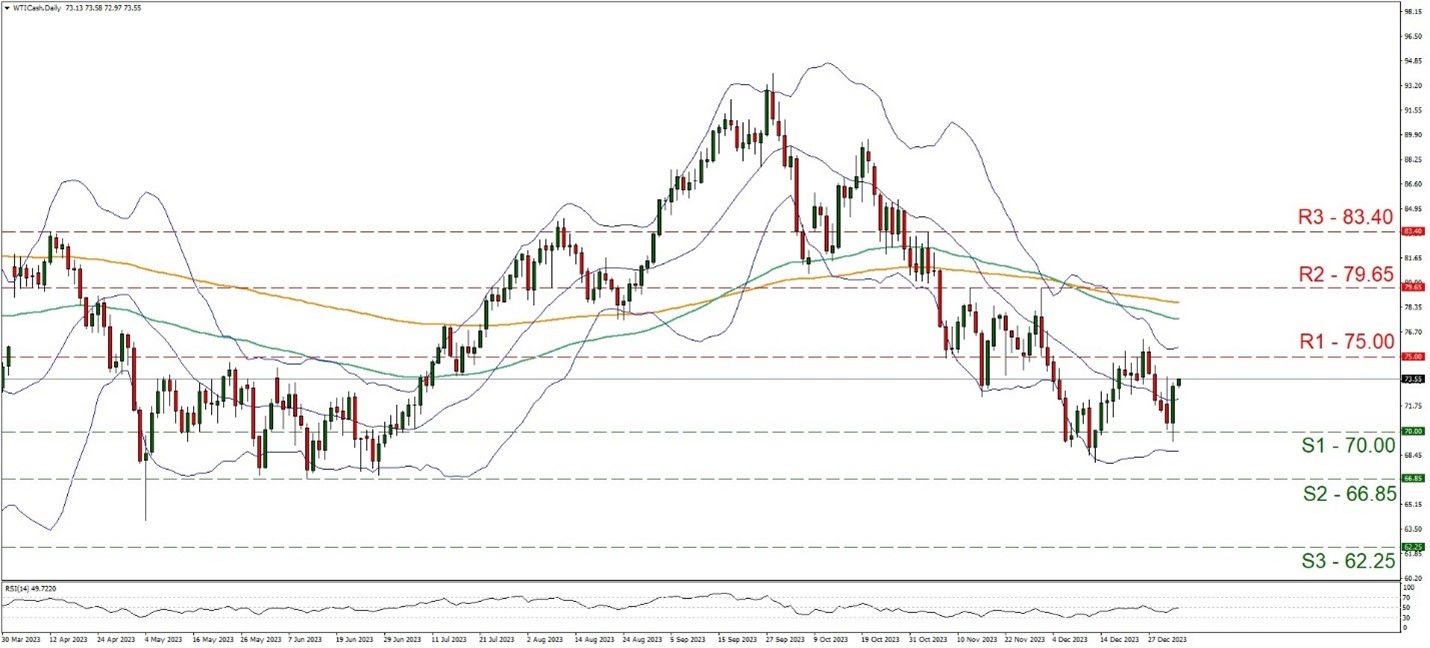
- Support: 70.00 (S1), 66.85 (S2), 62.25 (S3)
- Resistance: 75.00 (R1), 79.65 (R2), 83.40 (R3)
WTI’s price action jumped yesterday after bouncing on the 70.00 (S1) support line. We note that the movement marks a higher low of the commodity’s price action, yet for a bullish outlook, we would require also a higher high which would make us more certain of the bullish tendencies regarding the commodity’s price action.
For the time being, we tend to view the movement as signaling an interruption of WTI’s downward motion that was instigated on the 28 of September. Hence, we currently adopt a sideways motion bias between the 70.00 (S1) support line and the 75.00 (R1) resistance level.
Furthermore, we note that the RSI indicator remains near the reading of 50 implying a rather indecisive market that may allow the sideways motion to continue. For a bullish outlook, we would require a higher peak than the one on the 26 of December, thus WTI’s price-action has to break the 75.00 (R1) resistance line and start actively aiming for the 79.65 (R2) resistance next. Should the bears take over, we may see the commodity’s price action breaking decisively the 70.00 (S1) support line and aim, if not breach the 66.85 (S2) support base.
免责声明:
This information is not considered investment advice or an investment recommendation, but instead a marketing communication. IronFX is not responsible for any data or information provided by third parties referenced or hyperlinked, in this communication.


