
Since last report ,WTI’s upward movement last week appears to have been halted, with the movement of the commodity’s price action appearing to be stabilising since Tuesday. In today’s report we have a look at the situation in the Middle East, China’s oil demand and the state of the US oil market. The report is to be concluded with a technical analysis of WTI’s daily chart.
Slack in the US oil market
The latest data for the US oil market were quite interesting. On Friday, the weekly Baker Hughes oil rig count ticked up indicating an increase of active oil rigs in the US by one. The release was implying that higher demand may have pushed the number of active oil rigs in the US higher for a second week in a row.
Yet the release was quickly surpassed, as API on Tuesday reported a higher than expected increase of US Oil reserves, totally reversing last week’s drawdown of -1.580 million barrels by reaching 1.643 million barrels. Even more impressive was the release of the weekly EIA US crude oil inventories figure which showed an even wider rise of US oil inventories than API, by reaching as high as 5.474 million barrels.
Overall the US oil market data tended to highlight that oil production levels surpassed aggregated demand thus creating a slack in the US oil market. Should we see the slack in the US oil market being maintained in the coming week as well, with all other factors affecting oil prices being equal, we may see an adverse effect on oil prices being exercised.
Middle East conflict flares up supporting oil prices
In the latest development regarding the conflict in the Middle East, Israel launched strikes on Syria’s Damascus yesterday, in parallel with limited ground operations in Southern Lebanon and strikes on its capital Beirut.
The spillover of fighting into Lebanon and Syria has intensified worries that the conflict in Gaza could evolve into a full blown out regional war. In turn such developments understandably intensify fears for the international supply line of oil. At the same time, Israel’s response to Iran’s attack is still pending intensifying the uncertainty in the region.
It should be noted on the flip side that the US is intensifying its final push for a ceasefire in the area, before the US elections on the 5 of November, yet with little results. We see the case for Israel to wait out for a possible more favourable outcome of the US elections, with Trump winning, which could be interpreted as a free hand for the IDF’s operations. We expect that the conflict could escalate further in the coming week and if so, we may see bullish pressures on oil prices.
China raises crude import quota for oil refiners
On the demand side of the international oil market a positive signal came out on Tuesday providing support for oil prices. Media reported that China raised by 6% the total import quota for private importers for the year 2025, to roughly 257 million metric tons, or as per Reuters 5.14 million barrels per day (bpd).
The prior quota was of 243 million tons and applied for the current year. The news were accompanied also by news regarding investment in increased oil processing capacity in China as Shandong Yulong Petrochemical, has started operations at a 200k bpd unit.
Overall we note the signs towards a rise of the demand outlook of China which is important, yet at the same time we would also like to see increased economic activity in China’s manufacturing sector to be convinced about the potentials of Chinese demand. It should be noted that China’s crude oil demand was disappointing in the current year, at least so far and its characteristic that both OPEC and EIA earlier in the year were forced to revise downwards their expectations for the current year.
Latest data from China’s oil market point towards an easing, as crude oil imports for September fell by 0.6%, while at the same time, China’s oil refineries processed less barrels per day if compared to September of last year, despite a rise from August.
Oil Technical Analysis
WTICash Daily Chart
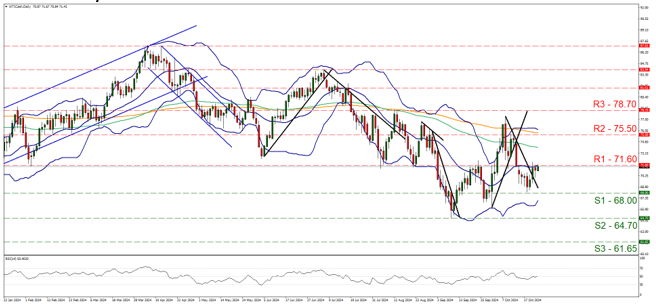
- Support: 68.00 (S1), 64.70 (S2), 61.65 (S3)
- Resistance: 71.60 (R1), 75.50 (R2), 78.70 (R3)
On a technical level, WTI prices rose since our last report yet edged lower yesterday after hitting a ceiling on the 71.60 (R1) resistance line. The commodity’s price action seems to have some difficulty at surpassing the resistance hurdle yet also during today’s Asian session took another swing at the specific level.
The RSI indicator remains at the reading of 50 implying a rather indecisive market regarding the future direction for the commodity’s price. We also note that the price action is near the 20 MA which is also the median of the Bollinger bands. Both indicators’ reading tend to suggest a stabilisation for WTI’s price which could continue to be just below or revolve around the 71.60 (R1) resistance level.
For a bullish outlook we would require WTI’s price to break clearly the 71.60 (R1) resistance line, which held its ground against the upward movement of the commodity’s price also on the 24 of September, proving its worth. Next possible stop for the bulls could be the 75.50 (R2) resistance base, while even higher we note the 78.70 (R3) resistance hurdle.
For a bearish outlook we would require WTI’s price to drop and form a lower trough than the last one which was formed on the 17 of October. Hence effectively for a bearish outlook WTI’s price action has to break clearly the 68.00 (S1) support line and start aiming for the 64.70 (S2) support barrier, which is also the lowest point reached by the commodity’s price in our chart. Even lower we note the 61.65 (S3) support level as an extreme target for the bears.
免责声明:
This information is not considered investment advice or an investment recommendation, but instead a marketing communication. IronFX is not responsible for any data or information provided by third parties referenced or hyperlinked in this communication.


