
Gold at the time of this report, seems to be moving in an upwards fashion, with the precious metal nearly reaching the $2000 key psychological level, compared to last week’s report on gold. We note the high volatility in the gold market, as tensions in the Middle East appear to continue rising, with the risk of a regional conflict, may keep volatility elevated until the current conflict is resolved. In this report, we aim to shed light on the catalysts driving gold’s price, assess its future outlook and conclude with a technical analysis.
Tensions in the Middle East remain elevated.
Over the weekend, regional tensions to have eased in the Middle East, as negotiations appear to be making some progress to the diplomatic effort by numerous countries to de-escalate the situation. The precious metal was just shy of punching above the $2000 key psychological figure last week.
Furthermore, the diplomatic efforts by numerous countries in the region, appear to have yielded some fruit, as the situation has yet to escalate to a wider regional conflict. The potential de-escalation may temporarily ease pressure in the commodities markets, as it may signal a willingness to diffuse the situation. However, it appears that the current situation in the Middle East could be described as a tinderbox waiting to explode. Thus, despite the apparent progress through diplomatic channels between regional actors, it appears to be superficial in our opinion and as such the potential risk of a wider conflict still appears to be at relatively high levels. In the event that the current conflict engulfs the Middle East, with various actors deciding to participate, we may see a strong reaction in the upwards direction in the commodities markets.
In particular, that of the precious metal, given gold’s status as a safe haven asset, we may see the precious receiving safe haven inflows. In addition, the potential widening of the conflict, could have long lasting implications in the region, as we had stated last week that market participants may be concerned about the impacts of a prolonged conflict. However, we would like to highlight once again, that should the conflict be resolved, we may see the precious metal weakening. Yet, that does not appear to be the case for now and as such the continued risks of a regional conflict, may in our opinion, provide support to the precious metal.
Tensions between China and the Philippines.
Tensions between China and the Philippines over the weekend, appear to have flared up, after a Chinese coast guard ship and one of Manila’s smaller wooden resupply boats made contact on Sunday. The incident comes, as geopolitical conflicts are seemingly appearing on different “theatres” and as such, may be concerning should they continue to escalate.
However, similar incidents seem to have occurred in the past and appeared to have yielded no significant impact on the financial markets. As such we may see a muted reaction by the markets to this incident. On the other hand, should the tensions between the two nations escalate to a more confrontational level, we may see the precious metal gaining support, given its status as a safe haven asset. We should note however, that such a scenario does not appear to be the case at this point in time.
Gold – Technical Analysis
XAUUSD 4-Hour Chart
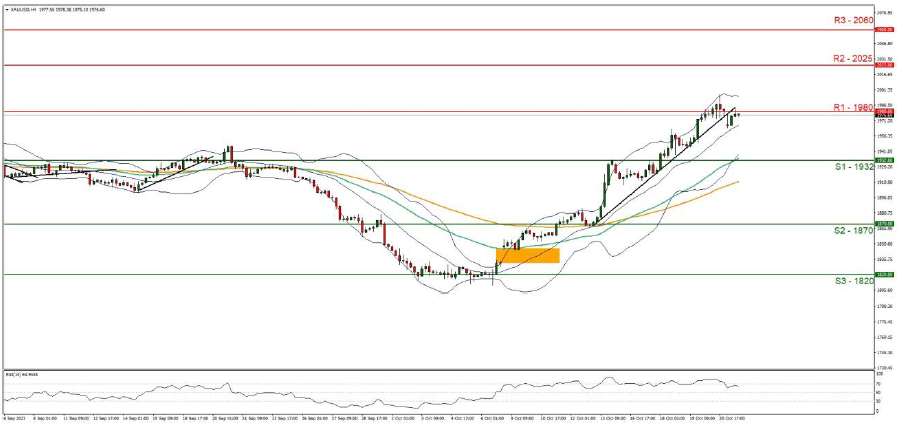
- Support: 1932 (S1), 1870 (S2), 1820 (S3)
- Resistance: 1980 (R1), 2025 (R2), 2060 (R3)
The precious metal appears to be moving in an upwards fashion, having broken above resistance turned support at the 1932 (S1) support level. We maintain a bullish outlook and supporting our case is the RSI indicator below our 4-Hour Chart which currently registers a figure near 70, implying a strong bullish market sentiment. For our bullish outlook to continue, we would like to see a clear break above the 1980 (R1) resistance level, with the next possible target for the bulls being the 2025 (R2) resistance line.
On the other hand, for a bearish outlook, we would like to see a clear break below the 1932 (S1) support level, with the next possible target for the bears being the 1870 (S2) support level. Lastly, for a neutral outlook, we would like to see the commodity remaining confined between the 1932 (S1) and the 1980 (R1) support and resistance levels respectively. However, we should note that despite the commodity breaking below our upwards moving trendline which was formed on the 13th of October, it did not break below the mid-range of the Bollinger bands.
As such, it may have been a market correction to lower ground. Lastly, we should emphasize that the Bollinger bands are still wide and as such may imply high market volatility.
免责声明:
This information is not considered investment advice or an investment recommendation, but instead a marketing communication. IronFX is not responsible for any data or information provided by third parties referenced or hyperlinked, in this communication.
