
Gold’s upward direction was maintained last week breaking record high levels and continuing to edge higher since our last report. In today’s report, we are to discuss the possible implications of the release of the US employment data for January on Friday, the fundamental issues created for gold traders by Trump’s tariffs and its relationship with the USD. For a rounder view, we will conclude the report with a technical analysis of gold’s daily chart.
USD’s negative correlation with gold’s price interrupted.
If one compares the movement of gold’s price over the past week with the respective movement of the USD Index, then it becomes obvious that the two trading instruments over the past week were not negatively correlated. Gold’s price advanced higher in a slow steady upward movement, while the USD Index also rose, despite an abnormality on Monday. A similar comment could be made also for the path of US bond yields which were on the rise since our last report yet failed to divert funds from gold towards US bonds despite an increase in their relative attractiveness. Hence we are forced to look for fundamentals leading gold’s price higher elsewhere.
Trump’s tariff back and forth game
Yesterday the Trump administration postponed at the last minute, imposing tariffs on US imports of Mexican and Canadian products. The postponement is to last for 30 days and tended to ease market worries somewhat. Yet that was not the case with the additional 10% tariffs across all Chinese imports in the US, which are now in effect.
The Chinese replied practically immediately, by imposing tariffs of 15% tariffs on U.S. coal and LNG and 10% for crude oil, farm equipment and some autos according to Reuters. Also, China is now reported starting that it will start an antimonopoly investigation in Alphabet’s Google and at the same time, included in its “unreliable entities list” some US companies. China is also imposing export controls over some rare earths and metals that are critical for hi-tech gadgets and the clean energy transition. The issue is expected to be maintained and on a fundamental level, should the frictions in the US-Sino relationships be enhanced, we may see them providing safe haven inflows for the precious metal.
Overall the risk factor has been elevated and the market’s uncertainty seems to intensify since Trump’s inauguration. The fast and high profile actions taken by the Trump administration not only in international politics tend to contribute to that end thus may benefit gold’s price.
The release of January’s US employment data
We note the release of the US employment report for January as the next big test for gold’s price. The non-farm payrolls is expected to drop to 170k if compared to December’s 256k, the unemployment rate to remain unchanged at 4.1% and the average earnings growth rate to slow down slightly. Should the actual rates and figures meet their respective forecasts, we may see them providing some support for gold’s price as it may imply a relative easing of the US employment market.
Yet the actual data tend to differ from prognosis, hence the element of surprise for the markets is quite probable and hence may lead to an asymmetric reaction of the market. Should the actual rates and figures show a tightening of the US employment market, we may see gold’s price retreating.
Gold Technical Analysis
XAUUSD 4H Chart
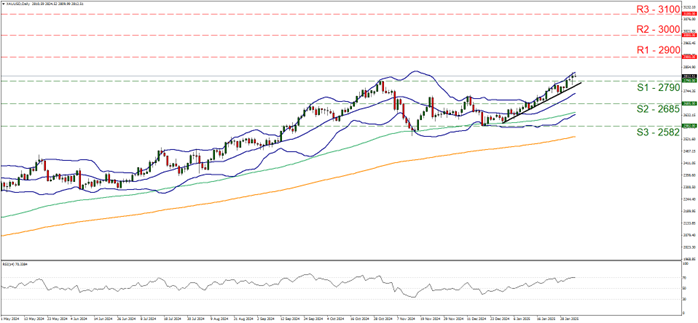
- Support: 2790 (S1), 2685 (S2), 2582 (S3)
- Resistance: 2900 (R1), 3000 (R2), 3100 (R3)
Gold’s price edged higher yesterday bouncing on the 2790 (S1) support level. We maintain a bullish outlook for gold’s price as long as the upward trendline guiding it since the 30 of December last year remains intact.
Furthermore we note that the RSI indicator has reached the reading of seventy, implying a strong bullish sentiment on behalf of gold traders, yet at the same time may be signaling that the precious metal’s price is nearing overbought levels which could make it ripe for a correction lower. Similar signals are being send by the fact that gold’s price action is constantly testing the upper Bollinger band.
Should the bulls maintain control over the precious metal’s price we set as the next target for gold’s bulls the 2900 (R1) resistance line. For a bearish outlook we would require gold’s price to reverse direction, break the 2790 (S1) support line, break the prementioned upward trendline in a first signal that the upward motion has been interrupted and continue lower, taking aim off the 2685 (S2) support base.
免责声明:
This information is not considered investment advice or an investment recommendation, but instead a marketing communication. IronFX is not responsible for any data or information provided by third parties referenced or hyperlinked in this communication.


