
US stock markets tended to remain relatively mixed in the past few days, maybe even some edging a bit lower. In this report, we aim to present the recent 基本的 和 economic news releases that impacted the US stock markets, look ahead at the upcoming 事件 that could affect their performance 和 conclude with a 技术的 analysis.
Fed’s hawkishness maintained
Overall we note that the Fed’s hawkish intentions seem to be maintained, signaling that the bank may not be over with monetary policy tightening. It was characteristic that Fed Chairman Powell in his before Congress last Wednesday more or less confirmed that more rate hikes lay ahead and stated that “Inflation - (通货膨胀) pressures continue to run 高, and the process of getting inflation back down to 2% has a long way to go,”. Furthermore, he reiterated that all FOMC policymakers expect that “it will be appropriate to raise interest rates somewhat further by the end of the year”, contradicting market expectations for rate cuts any time soon. The Fed Chairman cited the US employment market as being still tight despite some signs of easing. Overall the Fed Chairman maintain a clear hawkish tone in his , yet at the same time did not add something new. Should the bank’s hawkishness be maintained or even be more acute in the coming week, we may see US stock markets coming under pressure given the prospect of an even tighter monetary policy being applied for a longer period that could in turn weaken revenue 和 profitability.
Positive data supporting the market sentiment
On the other hand, we saw all three major US stock market indexes, namely the Dow Jones, S&P 500 和 Nasdaq rising a bit yesterday as the US data released tended to improve the market sentiment. Better than expected data from the US showed that consumer sentiment for June is more optimistic than expected, while at the same time, the number of new home sales for May was higher than expected, both pointing towards a more robust US economy and an appetite for more spending. Hence should we see in the coming days data implying a stronger US economy than expected, we may see market sentiment turning more risk-oriented and thus supporting assets such as equities which are considered riskier.
Apple reaches new all-time highs
Apple reached new record highs as the share’s price rose to the value of almost $188, as these lines are written. It would seem that the market is approving AR/VR headset gambling. Overall, the market seems to be recognising 和 approving the company’s consistency yet on a more practical level we note that the company was able to hike it’s iCloud+ subscription fees in many 个国家, an issue which is expected to have a positive impact on the company’s performance. Furthermore, we note that reports surfaced citing an increase of smartphone shipments to China have risen by more than 22% in May, news that may have also boosted share price. Last but not least we highlight opening to India, a relatively new market for the company which is also massive. On the other hand, there is no shortage of analysts citing that the share’s price may have reached overbought levels and may be ripe for a correction lower.
技术分析
US100 (Nasdaq) Daily Chart
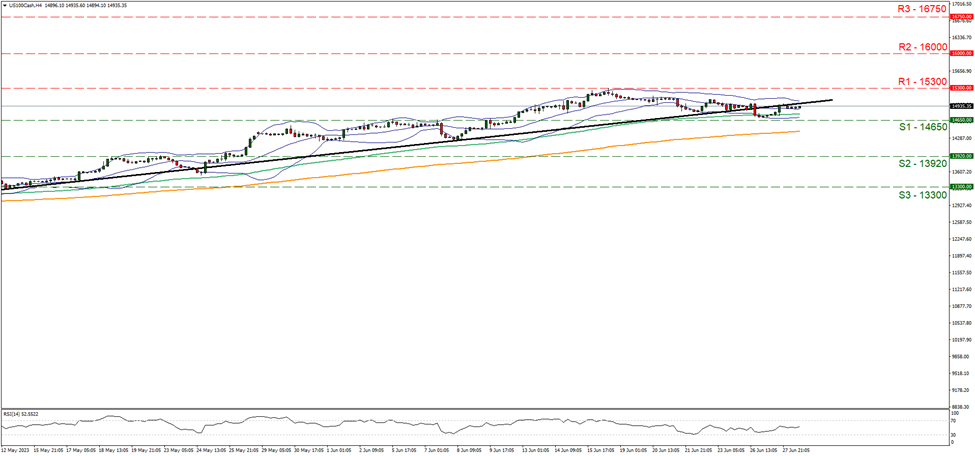
Support: 14650 (S1), 13920 (S2), 13300 (S3)
Resistance: 15300 (R1), 16000 (R2), 16750 (R3)
Nasdaq as mentioned in last week’s report hit a ceiling at the 15300 (R1) yet also tended to remain above the 14650 (S1) support line, overall maintaining a sideways motion. It’s characteristic of the sideways motion that the upward trendline guiding the index since the early days of May, was broken on Monday, exactly signaling the interruption of the upward motion. We tend to maintain our bias for the sideways motion to continue given that the RSI indicator remains just above the reading of 50 implying a rather indecisive market, maybe with some slight bullish tendencies. We also note the narrowing of the Bollinger bands, as a signal of lower 波动率 that may allow exactly the sideways motion to continue. Should the bulls take over, we expect the index to rise above the 15300 (R1) resistance line and aim for the 16000 (R2) resistance hurdle. On the other hand, should the bears be in charge of the index’s direction, we may see Nasdaq breaking the 14650 (S1) support line and aim for the 13920 (S2) support barrier, a move that would allow us to draw a downward trendline, exactly showing also the limitations of a possible downward movement.
如果您对本文有任何常规疑问或意见,请直接发送电子邮件至我们的研究团队,地址为 research_team@ironfx.com
免责声明:
本信息不被视为投资建议或投资推荐, 而是一种营销传播. IronFX 对本信息中引用或超链接的第三方提供的任何数据或信息概不负责.


