

Since our last report ,oil prices continued their downward motion over the past week, despite some upward corrections, underscoring the market’s bearish tendencies. Today we are to take a look at the state of the US oil market as well as other fundamental issues affecting the demand and the supply side of the international oil market. For a rounder view, we are to conclude the report with a technical analysis of WTI’s daily chart.
Easing of the US oil market and Trump’s tariffs
The US oil market seems to be easing. The signs since our last report, tend to point to that direction, as on Friday we saw the Baker Hughes oil rig count showed a reduction of active US oil rigs, from 478 to 472, which tended to imply that demand in the US oil market may have eased.
On Tuesday, we also got the API weekly oil inventories figure for the US which showed an increase of oil inventories in the US by 2.86 million barrels. Similar signals were sent also by the release of the EIA data which showed an even wider increase of US oil inventories, 3.46 million barrels.
Overall despite the API rise being lower than expected, tended to imply that production levels surpassed aggregated oil demand implying a slack in the US oil market and should we see such signals intensifying in the coming week it may enhance the bearish sentiment for the market for oil prices.
On the other hand, we note that tariffs of US imports from Canada and Mexico are to be applied from Saturday onwards and if actually so and considering that the US imports oil from these two countries, one could reasonably expect a possible tightening of the US oil market.
Furthermore we also note that the call of Trump of “drill baby, drill” may not have such a welcoming reception by producers especially shale producers as the cost is high and an outsized increase of oil production could lower prices to dangerously unprofitable levels. Thus the motive for such oil producers may be low.
Trump’s calls for OPEC to lower oil prices
Last Thursday, Trump in a speech at the World Economic Forum in Davos, Switzerland, called on Saudi Arabia and allied countries in the OPEC+ organisation to increase oil output, which in turn would result in a decrease of oil prices. Trump reasoned this call by the argument that a lowering of prices would tighten the financing of Russia for the war in Ukraine and thus peace could prevail. Despite the call having a possible bearish effect on oil prices, we see the case for OPEC members to reject the idea, as oil revenue is crucial for the financing of their nations’ budgets.
Even a possible increase in sales volumes is highly unlikely to compensate for the current level of current income. On the contrary, we may see OPEC considering a possible deeper oil production cut, as the oil producing cartel’s strategy relies on price maximisation rather than market share. Further more we see as unlikely the possibility of a price war in the international oil market between OPEC+ members and western producers as it may end up being a lose-lose situation for both sides.
Analyst’s opinion
“We do see the case for oil prices to continue to fall in the coming week, as on a fundamental level the echo of Trump’s efforts to lower prices may be repeated. Furthermore, we note that the Fed’s decision to remain on hold and showing little if any hurry to cut rates may keep financial conditions in the US economy tight, thus possibly weighing somewhat on growth and subsequently oil demand thus having a possible bearish effect on oil prices. Also we note that the expansion of economic activity in the manufacturing sectors in the US and China seems to remain subdued in January, yet more clues on this are expected to be revealed by the release of the relevant PMI figures for the current month in the coming week and their release may prove to be important for prices in the current stage.”
Oil Technical Analysis
WTI Cash Daily Chart
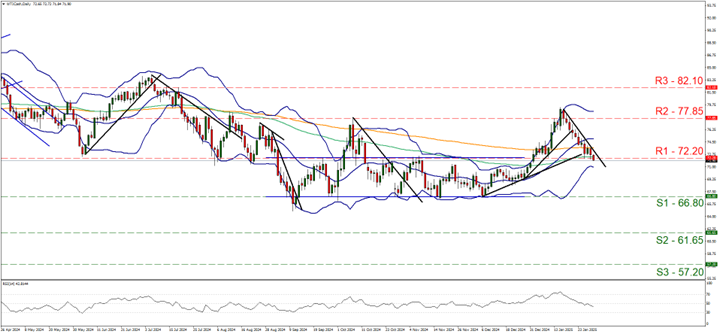
- Support: 66.80 (S1), 61.65 (S2), 57.20 (S3)
- Resistance: 72.20 (R1), 77.85 (R2), 82.10 (R3)
WTI’s downward motion was maintain as it continued edging lower yesterday and during today’s Asian and early European session, breaking the 72.20 (R1) support line, now turned to resistance. Given that the downward trendline guiding the commodity’s price lower remains intact we maintain our bearish outlook for oil prices at the current stage.
We also note that the RSI indicator which maintained its downward motion breaking below the reading of 50, implying a bearish predisposition among market participants for WTI’s price, which in turn may allow for the downward motion to be continued. Should the bears maintain control over the WTI’s price, we may see it aiming if not breaching the 66.80 (S1) support line, while even lower we note the 61.65 (S2) support level.
A bullish outlook seems currently remote and for its adoption we would require WTI’s price action to reverse direction, by breaking the 72.20 (R1) resistance line and continue to break the prementioned downward trendline, in a first signal that the downward motion has been interrupted and continue to aim if not break the 77.85 (R2) resistance base.
免责声明:
This information is not considered investment advice or an investment recommendation, but instead a marketing communication. IronFX is not responsible for any data or information provided by third parties referenced or hyperlinked in this communication.


