Oil prices have moved decisively higher since our last report, highlighting the market’s bullish intentions. Today we are to take a look at the situation in the US oil market and continue to examine issues affecting the fundamentals of the demand and supply side of the international oil market. For a rounder view, we are to conclude the report with a technical analysis of WTI’s daily chart.
US oil market tightens
Making a start with the US oil market we note that Baker Hughes reported a decrease in the number of active oil rigs in the US by two, bringing the figure down from 482 to 480. The release may have been more on the bearish side for oil prices implying that demand levels may have dropped forcing producers to shut down two rigs. Yet that picture was overturned on Tuesday as API reported a drawdown in US oil inventories of -2.6 million barrels.
Despite the drawdown being narrower than the last reading, it still implied that aggregated demand was able to surpass oil production levels in the US and thus showing a tightness of the US oil market. That picture was verified the next day as EIA also reported a drawdown, this time even wider than the last release yet narrower than expected. Overall, should data related to the US oil market continue to show a relatively tight situation we may see oil prices getting further support.
US sanctions on Russian oil
Some analysts are mentioning that the stronger Dollar may have contributed to the rise of oil prices yet that remains currently maybe a secondary issue in our opinion. We highlight that the US Treasury Department on Friday imposed sanctions on Gazprom Neft and Surgutneftegas as well as 183 vessels that trade oil as part of Russia’s so-called “shadow fleet” of tankers, as per Reuters.
The sanctions practically could strain the supply chain of the international oil market, creating possibly a bottleneck and thus have a bullish effect on oil prices. The situation gets even tighter if one considers that the Russian ships being sanctioned served primarily Indian and Chinese demand which in turn seems to be robust if not increasing, thus oil exports from other countries may have to be diverted towards China and India.
IEA’s and OPEC’s contrasting oil demand expectations
An other issue that caught oil traders’ attention were OPEC’s optimistic expectations for international oil demand. In it’s Monthly Oil Market Report, OPEC repeated its forecast that global oil demand will expand at a robust clip at 1.4 mb/d in 2025, largely driven by strong non-OECD (Organization for Economic Co-operation and Development) growth. It should be noted that the oil producing organisation expects demand to remain high also in 2026 as it stated that “Transportation fuels are set to drive 2026 oil demand growth, with air travel expected to see continued expansion, as both international and domestic traffic continues to increase,”.
On the flip side, the International Energy Agency (IEA) sees oil demand continuing to grow, yet at a slower pace. The France-based agency said it expects global oil demand to grow by 1.05 million barrels per day versus the 1.1 million B/D it forecast last month. Yet even with IEA’s moderated expectations growth for oil demand, seems to remain healthy and thus could provide some support for oil prices.
Israel and Hamas strike ceasefire deal?
It should be noted that that Israel and Hamas have reached a ceasefire deal. The deal includes terms for a release of hostages in practically three stages and should be enforced from Sunday onwards. Yet the deal seems to be fragile and dozens have reportedly been killed since the agreement was reached. Also it still has to be approved by the Israeli cabinet which has been delayed. There seems to be some hesitation on behalf of Israel to actually approve the deal. Its characteristic that the Israeli Government blames Hamas for reneging on parts of the agreement.
The group said it is “committed” to the truce. Also we note that far right Israelis are currently demonstrating against the deal. Should we see the ceasefire deal being enforced, we may see market worries for the issue easing and thus may have a bearish effect on oil prices. On the flip side a possible backtracking of any of the two sides resulting in the possible deal falling through could boost oil prices as market worries could be reignited.
Oil Technical Analysis
WTI Cash Daily Chart
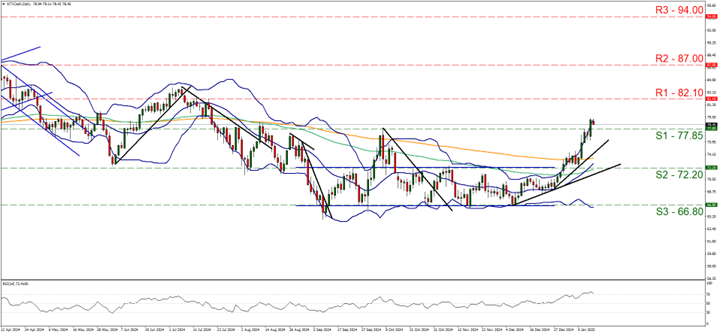
- Support: 77.85 (S1), 72.20 (S2), 66.80 (S3)
- Resistance: 82.10 (R1), 87.00 (R2), 94.00 (R3)
WTI’s upward motion intensified since our last report as the commodity’s price broke the 77.85 (S1) resistance line now turned to support, marking an increase beyond 7% in a week.
We also note that the upward motion steepened its slope highlighting the intense bullish interest and we intend to maintain an upward outlook for the commodity’s price as long as the upward trendline remains intact. Furthermore we note that the RSI indicator has surpassed the reading of 70, highlighting the strong bullish sentiment of the market for WTI’s price, yet at the same time may imply that WTI has reached overbought levels and is ripe for a correction lower. Similar signals are being send by the fact that the price action is constantly flirting with upper Bollinger Bands.
For our bullish outlook to continue we would require the commodity’s price to break above the 82.10 (R1) resistance level, with the next possible target for the bulls being the 87.00 (R2) resistance barrier, a level marking practically a six month high. For a bearish outlook, we would expect the pair to break initially the 77.85 (S1) support line and continue lower to clearly break the prementioned upward trendline, in a first signal that the upward motion has been interrupted and continue to also break the 72.20 (S2) support level.
The next possible target for the bears could be the 66.80 (S3) support barrier, which was the platform of the bullish wave we are currently trading.
免责声明:
This information is not considered investment advice or an investment recommendation, but instead a marketing communication. IronFX is not responsible for any data or information provided by third parties referenced or hyperlinked in this communication.


