

Oil prices appear to have moved higher with the start of the New Year. Today we are to take a look at the recent executive order signed by Biden, the reduction of Saudi oil exports to China and finish of with the data of the US oil market. For a rounder view, we are to conclude the report with a technical analysis of WTI’s daily chart.
Biden’s last HOORAH for the climate activists
On the 6 of January, president Biden signed an executive order which would withdraw certain areas of the United States Outer Continental Shelf from oil or Natural gas leasing. Essentially president Biden has announced an offshore oil and gas drilling ban for areas which are part of the Northen Bering Sea Climate Resilience Area amongst other parts. The outgoing president has used the 70-year-old Outer Continental Shelf Lands Act which allows presidents to remove areas from mineral leasing and drilling but does not allow presidents the legal authority to overturn prior bans according to a 2019 court ruling.
The announcement may have sparked concern about potential limitations for the incoming administration which aims to increase energy production in the US as seen by Trump’s moto of “drill baby drill”. Moreover, the incoming president for his part has vowed to “revoke the offshore oil, gas drilling ban in vast areas on day one”, which may be slightly optimistic as it may require congressional approval in order to be overturned, implying that it cannot be ‘undone’ immediately.
Nonetheless, President Trump has also stated per Reuters that his administration would open up oil and gas development in the Artic National Wildlife Refuge and may take the matter to court if necessary, per Reuters.
Overall, should President-elect Trump manage to quickly overturn President Biden’s executive order, in addition to quickly granting oil drilling permits, it may imply that the US oil production levels could increase in the near future. In turn the implications of an increase in supply, could weigh on prices as production levels could exceed the current demand in the US.
Saudi oil exports to China to decrease
According to Reuters, Saudi Arabia’s crude oil supply to China is set to decline in February from the prior month. The report by Reuters stated that Saudi Aramco will ship about 43.5 million barrels to China in February which would be lower than last month’s figure of 46 million barrels. The report by Reuters, tends to amplify our repeated concerns in regards to the Chinese economy.
We have maintained the belief that the Chinese economy may continue facing hardships in 2025. Aiding our aforementioned hypothesis was the release of China’s NBS and Caixin manufacturing PMI figures for December which were released last week and came in lower than expected. In particular, both figures are veering dangerously close to contraction territory.
Nonetheless, the implications of reduced oil demand from China, the world’s largest imported, may be concerning for oil prices, as a continued reduction of demand from China, could lead to downwards pressures on oil prices.
The data of the US oil market
Starting with the US oil market we note that the Baker Hughes indicator showed that the number of active oil rigs in the US was reduced by one to 482. The release signalled that the increase of active US oil rigs was halted, which could also be perceived as an indication a slack in oil demand in the US.
Nonetheless, this Tuesday the API weekly crude oil inventories figure was released showcasing a considerable drawdown of -4.022 million barrels in US oil inventories. The release implied a continued tightness of the US oil market for a fourth week in a row which may be perceived as bullish for oil prices as aggregated oil demand surpassed production levels once again. However, the EIA on Wednesday also reported a drawdown -0.959 million barrels, which was lower than the expected drawdown of -1.8 million barrels.
The lower-than-expected drawdown may imply that production levels may be meeting the current oil demand in the US and thus should they exceed demand levels, they could weigh on oil prices. Nonetheless, generally speaking the demand for oil in the US has once again surpassed oil production levels and thus may have aided oil prices during the week. However, should that narrative change in the coming week, it may have the opposite effect on oil prices.
Oil Technical Analysis
WTI Cash Daily Chart
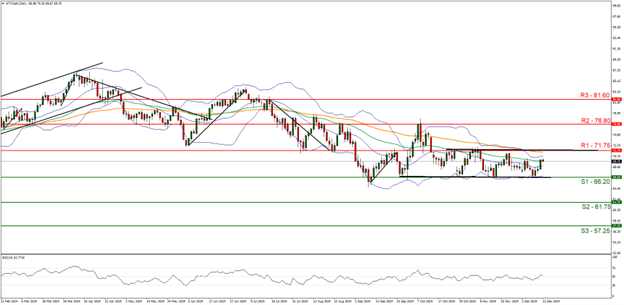
- Support: 71.75 (S1), 66.20 (S2), 61.75 (S3)
- Resistance: 76.80 (R1), 81.60 (R2), 85.85 (R3)
WTI appears to be generally moving in an upwards fashion. We opt for a bullish outlook for the commodity’s price and supporting our case is the RSI indicator below our chart which currently registers a figure above 60, implying a bullish market sentiment in addition to the upwards moving trendline which was incepted on the 9 of December 2024. For our bullish outlook to continue we would require the commodity’s price to remain above the 71.75 (S1) support level, in addition to a break above the 76.80 (R1) resistance line, with the next possible target for the bulls being the 81.60 (R2) resistance level.
On the flip side for a sideways bias, we would require the commodity’s price to remain confined between the 71.75 (S1) support level and the 76.80 (R1) resistance line. Lastly, for a sideways bias we would require the commodity’s price to clearly break below our 71.75 (S1) support level, with the next possible target for the bears being the 66.20 (S2) support line.
免责声明:
This information is not considered investment advice or an investment recommendation, but instead a marketing communication. IronFX is not responsible for any data or information provided by third parties referenced or hyperlinked in this communication.


