

Metatrader 4 indicators are important tools for traders who use 技術分析 to analyse financial markets. They offer a way of gauging the behaviour of the market and identifying potential trading opportunities in real-time. These indicators consider data such as price and volume to find patterns and trends that can be used to make trading decisions. Understanding the strengths and weaknesses of technical MT4 indicators can help traders to improve their trading results.
MT4 indicators and technical analysis
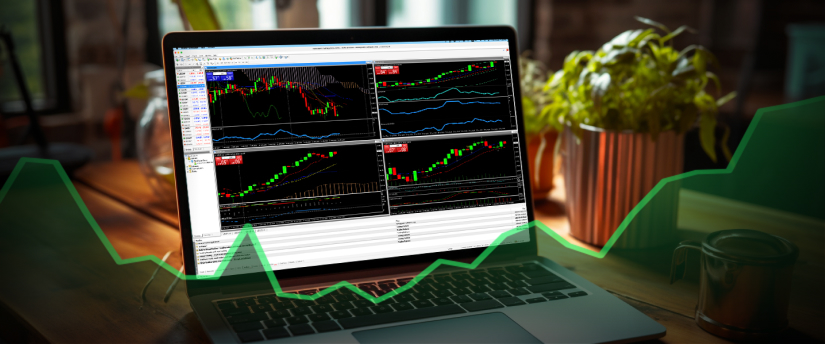
MetaTrader 4 (MT4) was developed by MetaQuotes Software in 2005. It is a popular online trading platform as it provides traders with a variety of technical analysis tools, advanced charting capabilities, and a range of indicators to help them implement their trading strategies. This includes more than 30 built-in indicators, 2000 free custom indicators and 700 paid ones.
What are technical indicators?
Technical indicators are mathematical calculations based on historical price and volume data. These Metatrader 4 indicators are applied to charts to create visual representations of market trends, patterns,並且 potential entry 和 exit points.
There are many different types of technical indicators, including momentum indicators, trend indicators, 波动率 indicators, and volume indicators.
- Trend indicators identify the direction of the market trend.
- Momentum indicators gauge potential trend reversals and measure the strength of market trends.
- Volatility indicators measure the range of price movements in the market.
- Volume indicators measure the number of trades taking place.

Top MT4 technical indicators
1. Moving average MT4 indicators
Moving averages, which are trend indicators, are among the most popular MT4 indicators in forex trading.
Traders use these indicators to identify price trends in the market by averaging price data over a specific period. This can help you determine the direction of the trend using historical prices. You may also use periods of different lengths to measure moving averages. A rising moving average indicates an uptrend, while a falling moving average signals a downtrend.
There are two main types of moving average indicators: Simple Moving Average (SMA) and Exponential Moving Average (EMA). The primary difference between the two is how they weight data points over time.
The SMA averages price data over a period, assigning equal weight to each price. In contrast, the EMA places more weight on recent prices, making it more responsive to price changes than the SMA.
2. Ichimoku MT4 indicator
The Ichimoku Kinko Hyo indicator was developed by Japanese journalist Goichi Hosoda in the late 1930s. The Ichimoku indicator consists of 5 lines plotted on a price chart, providing a complete view of the market to identify potential trends and market reversals.
The 5 lines of the Ichimoku indicator are:
Tenkan-sen (Conversion line)
Tenkan-Sen, or Conversion Line, is the mid-point of the highest and lowest prices of an asset over the previous nine periods.
Kijun-sen (or base line)
The Kijun-sen is the midpoint price of the last 26-periods.
Senkou Span A (Leading Span A)
Span A represents the midpoint between the Tenkan-sen and Kijun-sen lines and then the result is plotted 26 periods ahead.
Senkou Span B (Leading Span B)
This is the total of the highest high and the lowest low divided by 2. Senkou Span B is calculated using 52 periods of data and is plotted 26 periods ahead.
Chikou Span
The Chikou span is created by plotting closing prices that are 26 periods behind the last candlestick or bar. This span helps traders gauge an asset’s momentum and identify potential trend changes. The Chikou span is used together with the other elements in the Ichimoku indicator.
The Ichimoku Kinko Hyo indicator is a popular tool among technical analysts, especially for forex traders. However, like any technical indicator, it should not be used alone. It is best used in combination with other 技术的 和 基本面分析 tools to make well-informed trading decisions.
3. Relative Strength Index
The relative strength index (RSI), introduced in 1978, is a popular momentum oscillator. It provides technical traders with signals about bullish and bearish price momentum and is often plotted below an asset’s price chart. Assets are usually considered overbought when the RSI is above 70 and oversold if it falls below 30. Traders often interpret the RSI line crossing below the overbought line or above the oversold line as a signal to buy or sell. The RSI is most effective in trading ranges rather than trending markets.
4. Stochastic Metatrader 4 indicator
A popular indicator for generating overbought and oversold signals is the stochastic oscillator. Developed in the 1950s, it is a popular momentum indicator that varies around a mean price level based on an asset’s price history. Stochastic oscillators measure the momentum of an asset’s price to identify trends and predict reversals. They evaluate recent price movements on a scale ranging from 0 to 100, with readings above 80 indicating that an asset is overbought and measurements below 20 indicating that it is oversold.

5. Bollinger Bands MT4 indicator
Bollinger Bands, a popular technical analysis tool, is used to determine where prices are high and low relative to each other. These consist of three lines: a simple moving average (the middle band) and an upper 和 lower band. The upper band acts as a resistance level, while the lower band acts as a support level. These bands measure 波动率, reflecting the degree of price variation over a specific period and automatically adjust to changing market conditions. When prices rise, the bands widen; when prices become stable, the bands narrow.
Traders often use Bollinger Bands with other technical analysis tools to confirm potential trading opportunities. However, it’s important to remember that there is no technical analysis tool that can guarantee profits. You should always consider your risk tolerance 和 financial goals before you make any trading decisions.
6. Average True Range
The Average True Range (ATR) is another technical indicator used to measure volatility. It shows the average range of price movement over a specific period.
Technical analysts may use the ATR to enter and exit trades, making it a useful tool to add to a trading system. It was created to help traders accurately measure the daily volatility of an asset using simple calculations. This indicator does not indicate price direction; instead, it measures volatility caused by gaps and limit up or down moves. The ATR requires only historical price data.
7. Parabolic SAR
Parabolic SAR is used as a Metatrader 4 technical indicator to determine trend direction and potential reversals in price. It uses a trailing stop and reverse method called “SAR” or stop and reverse to identify suitable exit 和 entry points.
On a chart, the parabolic SAR indicator appears as a series of dots either above or below an asset’s price, depending on the price direction. When the price is trending upward, a dot is placed below the price; when the price is trending downward, a dot is placed above it.
8. On-Balance Volume
On-balance volume (OBV) is a technical momentum indicator. It uses volume changes to predict price movements. The indicator shows crowd sentiment, offering insights into bullish or bearish outcomes. Analysing the interaction between price bars and OBV generates more actionable signals compared to the green or red volume histograms commonly seen at the bottom of price charts.
9. Awesome Oscillator
The Awesome Oscillator, a technical analysis tool developed by Bill Williams, gauges market momentum by comparing a 34-period and a 5-period Simple Moving Average (SMA) of price midpoints. It compares recent market movements to historical market movements.
Typically presented as a histogram with green or red bars, the Awesome Oscillator indicates that the market momentum is increasing when bars are green and decreasing momentum when the bars are red. The height of the bars also indicates momentum strength.
Traders use the Awesome Oscillator to spot potential buy 或者 sell signals. However, there are some limitations in using this technical indicator as it can provide false signals depending on the strategy used. Therefore, traders often use the Awesome Oscillator with other technical analysis tools to confirm their trading decisions.
10. Moving Average Convergence / Divergence (MACD)
The MACD indicator is used for trend trading. Its role is to chart the distance (the difference) between two price moving averages. The MACD also helps to identify whether a bullish 或者 bearish price momentum is getting stronger or declining. The MACD is considered effective in volatile trading environments. Traders use this technical indicator in three ways: through crossovers, divergences, or as an overbought/oversold indicator.

Open a demo account to practise technical analysis
Opening a demo trading offers a convenient way to practise skills in using different technical indicators to maximise profits, regardless of skill or expertise. A demo trading account provides a virtual trading environment for you to practise CFD trading, without risking your own capital. It can be used to understand the complexities of technical Metatrader 4 indicators before placing live trades.
A demo account also provides the market conditions to test a range of trading strategies under market conditions. Using a demo trading account through a CFD broker like IronFX also gives you access to current market insights so you can be informed of any emerging trends, volatilities or fluctuations.
免责声明:
This information is not considered investment advice or an investment recommendation, but instead a marketing communication. IronFX is not responsible for any data or information provided by third parties referenced or hyperlinked in this communication.


