
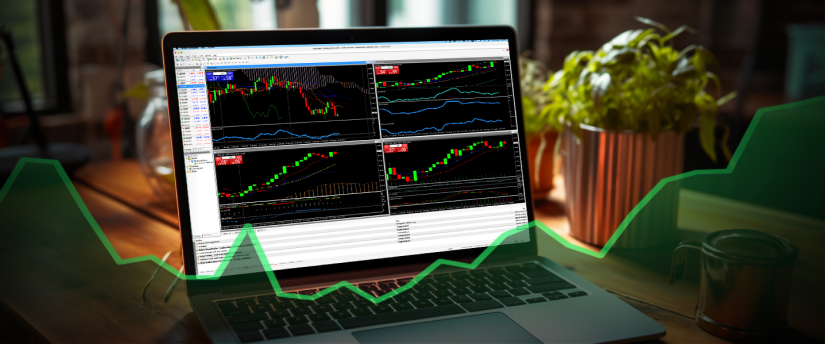
In the fast-paced world of foreign exchange trading, technical analysis in forex is the lens through which traders view price action. Instead of relying on economic reports or central bank commentary alone, traders look directly at price charts to find patterns, trends, and signals that can help them make fast and more accurate decisions.
Technical analysis does not attempt to predict the future direction of an asset with certainty, but it does provide traders with a systematic way of interpreting market action and improving their chances of being better traders.
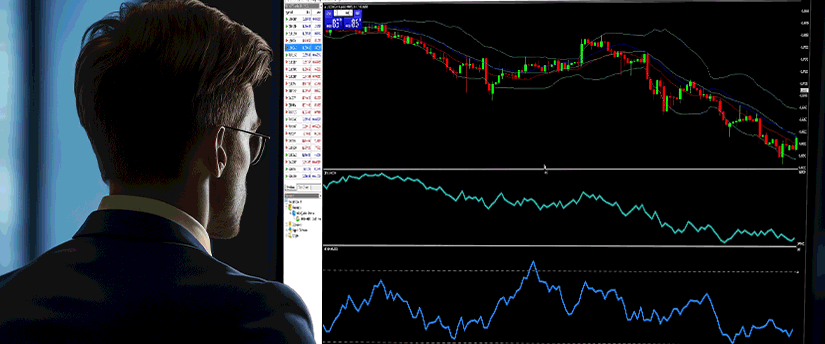
To experienced traders, technical analysis is not just a mere tool, but it is a daily routine. A forex trader checks charts before entering any trade, so they have a clear idea of where the markets are heading.
Why traders use charts
Charts show how currencies trend, how buyers and sellers react, and how emotions like fear and greed dictate price movements. Unlike fundamental analysis, which digs up macroeconomic indicators, technical analysis focuses on what’s already visible: price, volume, and patterns.
With charts, traders can identify a trend’s direction, find entry and exit points, determine if a market is overbought or oversold at any time and manage risks by placing stops at key chart levels.
Fundamentals of forex price charts
Line charts record closing prices with a straight line. They eliminate the noise of intraday price movement and thus are useful for determining long-term trends.
Bar charts show the opening, closing, high, and low prices for each period while candlestick charts show price movement through “candles” which also display the opening, closing, highs, and lows. Dojis, hammers, or engulfing candles are patterns that provide insight into possible reversals.
Technical Analysis Market trends
Trends form the basis of technical analysis. As the saying goes, “the trend is your friend.”
An uptrend is formed when prices consistently make higher highs and higher lows. Traders buy dips in uptrends.
A downtrend is when lower highs and lower lows are the norm. Traders look for short-selling opportunities here.
Sideways trends occur when markets consolidate and trade within a narrow range. Breakouts from these ranges have a tendency to spark strong price movements.
Key technical indicators that traders use in Technical Analysis
Indicators summarise raw data and highlight signals in charts.
Moving averages (MA) smooth out price volatility. The 50-day and 200-day moving averages are widely used to define long-term trends. Exponential moving averages (EMA) give more weight to recent prices, making them faster to react.
Relative Strength Index (RSI) plots momentum and identifies overbought (above 70) or oversold (below 30) conditions. Traders typically seek divergences between RSI and price.
The Moving Average Convergence Divergence (MACD) compares two moving averages to identify changes in momentum. A crossover of the MACD line and the signal line typically indicates entry or exit points.
Bollinger Bands travel with volatility, widening and narrowing. Price hitting the upper band can be overbought; price hitting the lower band can be oversold.
Chart patterns that signal market moves
The Head and Shoulders is a reversal pattern that has a tendency to signal the completion of an uptrend. An inverted head and shoulders is the reverse.
Double Tops and Bottoms
Is another pattern. The double top implies a bearish reversal, and the double bottom is typically a bullish reversal sign.
Triangles and Flags
These are continuation patterns and often appear in breaks in a trend before the price resumes in its direction.
支持与阻力
Levels are also very important. Support is a price floor where buyers enter, and resistance is a ceiling where sellers take over. Identification of these levels allows traders to place stop-losses and profit targets wisely.

The role of volume in technical analysis
Volume measures how many traders are trading. Rising volume on a breakout validates the move. Light volume, on the other hand, can signal a false signal. Volume is ignored by most traders, but expert traders use it as confirmation.
Combining technical analysis with market psychology
Charts reflect human psychology with fear, greed, optimism, and panic influencing trend lines and candlestick patterns. A trader who understands that behind every candle there is the influence and power of collective human behaviour, is more attuned with the markets and more able to discern when a trend is generated by momentary fear or is the result of deeper and more long-term forces.
Risk management with the help of technical analysis
Technical analysis is also a form of protecting a trade as traders can use stop-loss orders at support levels or trailing stops if it is a trend, to limit losses. Traders who have experience and are consistently correct are not necessarily right on every single trade but they tend to be good at preserving their funds, trading without losing too much and knowing when to lock in their profits.
Mistakes beginners make with charts
In spite of having tools at their disposal, traders who are just starting may fail and this is because of a variety of mistakes such as overloading charts with too many indicators, ignoring the longer-term trend in preference for near-term signals, entering into emotional trading and mistaking random price noise for information signals.
It is as necessary to learn to avoid these traps as it is to learn chart analysis.
The power of timeframes in technical analysis
One of the most overlooked factors in forex technical analysis is the influence of timeframes. The same chart can be saying entirely different things depending on whether you are looking at a one-minute, an hourly, or a daily timeframe.
Scalpers tend to employ extremely short timeframes, such as one-minute or five-minute charts, in an attempt to catch small, quick moves. Swing traders may look at hourly or daily charts to ride medium-term waves. Long-term position traders look at weekly or monthly charts, filtering out the short-term “noise” to view the bigger picture.
Good traders do not get fixed in one timeframe. They use multiple timeframe analysis, zooming out to gain a sense of the overall trend before zooming in for precise entries. This habit prevents traders from trading against the larger market momentum.
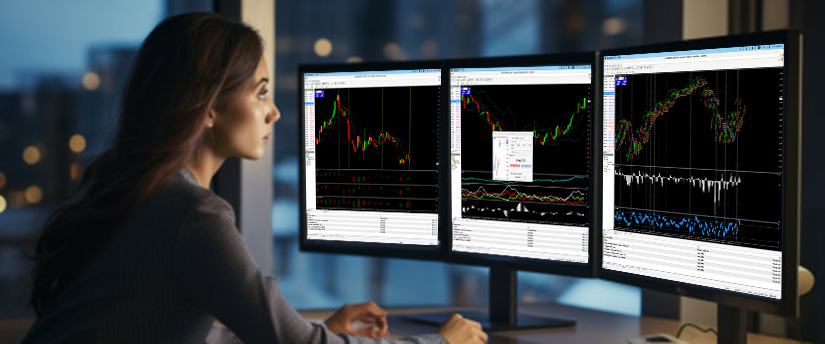
How traders merge indicators for more reliable signals
While each technical indicator has its application, professionals never rely on any one of them. Professional traders combine indicators to filter out false signals. A trader, for example, may wait for a moving average crossover to be confirmed by an RSI reading that shows momentum in the same direction.
This multi-layered methodology helps to build confluence areas where many technical signals meet. Confluence increases confidence and reduces the likelihood of entering trades based on random noise.
Traders must find a balance, however. The use of too many indicators can create analysis paralysis, making it difficult for traders to make the right decision or getting too many opposing signals. The best thing to do is decide on a few good and strong tools and learn how to use them instead of using too many random and conflicting indicators.
Why patience is the trader’s secret weapon
Technical analysis is about waiting for the market to align with your strategy. Many professionals emphasise that trading is 80% patience and discipline, and only 20% execution.
Charts present opportunities on a daily basis, yet few of those opportunities meet a trader’s risk profile and strategy. By being patient, traders can avoid overtrading and save capital for high-probability setups.
Conclusion
Forex technical analysis is a skill that comes with time, discipline, and consistency. For those willing to put in the work, technical analysis transforms charts from random price movements into a roadmap for smarter trading decisions.
Technical analysis is a mindset more than it is a collection of tools. By learning to master patterns, indicators, and psychology, traders improve their chances in the forex market.
In the end, charts don’t predict the future, but they extrapolate possibilities. And for the disciplined trader, that’s all one requires to trade in the long term and consistently with confidence.
Disclaimer:
This information is not considered investment advice or an investment recommendation, but instead a marketing communication.


