
Since our last report oil prices seem to have relatively stabilised. In today’s report we are to discuss some fundamental issues which affect or could affect oil prices and are related to the supply and the demand of the international oil market. We are to compliment the fundamentals with a technical analysis of WTI’s daily chart.
US Oil market data showcases mixed signals
Having a look at the US oil market we note that the number of active oil rigs in the US, as per Baker Hughes, ticked down to 465 from 473. The drop was interpreted as a bearish signal as it implies that reduced oil demand may have forced oil producers to shut down eight oil rigs.
On Tuesday API reported a decrease of US oil inventories, by 4.236 million barrels, a figure which is much lower than last week’s reading of a 2.499 million barrel increase. The decrease of oil inventories as reported by API may have cast doubt on the narrative seen from the reduction of active oil rigs in the US, which in turn may have aided oil prices.
Yet on Wednesday, EIA reported an increase in oil inventories by 1.328 million barrels and thus in turn may have weighed on oil prices. Overall, the API and EIA appear to be contradicting one another, and thus may be sending mixed signals to market participants.
Thus, should the API and EIA wti inventories showcase a drawdown next week, it may imply an increase in demand which could aid oil prices, whereas should they showcase an increase in wti inventories it may imply that supply has surpassed demand it may instead weigh on oil prices.
US Court of International Trade rules against Trump
The US Court of International Trade has ruled that US President Trump has exceeded his authority in regards to the imposition of global tariffs, with the court declaring them unlawful.
Specifically the court stated per Reuters “The Court of International Trade said the U.S. Constitution gives Congress exclusive authority to regulate commerce with other countries that is not overridden by the president’s emergency powers to safeguard the U.S. economy” and that the Judges have ordered the Trump administration to issue new orders reflecting the permanent injunction.
We would not be surprised to see the decision being appealed by the Administration, yet the ruling may ease trade war concerns and thus could potentially improve the global economic outlook, which could also imply an increase in demand for oil. Thus the decision may have temporarily aided wti prices and should the ruling stand it may further aid the commodity’s price in the future. On the other hand, should the decision be ignored or reversed it may have a bearish effect on oil prices.
OPEC+ to meeting again on Saturday
OPEC+ per Bloomberg, is set to meet this Saturday, where the wti cartel could announce an increase of 411,000 barrels per day in July, a move which could be described as “opening the tap”. Thus, should OPEC+ decide to announce an increase in oil supply at their meeting on Saturday, it could weigh on oil prices as the supply of oil into the market may increase whilst demand remains steady. However, should the meeting pass with no announcement of an increase in oil supply it may cast doubt on the aforementioned possibility which in turn could aid wti prices
Oil Technical Analysis
WTI Cash Daily Chart
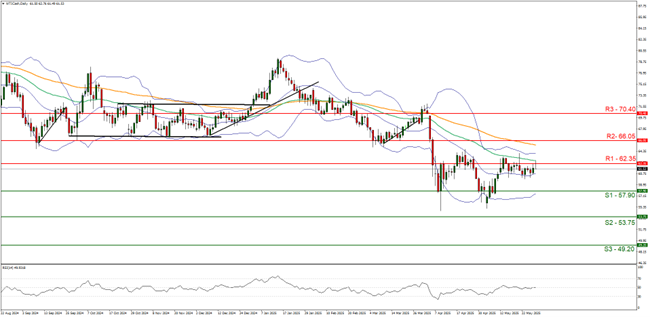
- Support: 57.90 (S1), 53.75 (S2), 49.20(S3)
- Resistance: 62.35 (R1), 66.05 (R2), 70.40 (R3)
WTI’s price appears to have dropped back below our 62.35 (R1) resistance level. We opt for a sideways bias for the commodity’s price and supporting our case is the RSI indicator below our chart which currently registers a figure near 50, implying a neutral market sentiment. For our sideways bias to be maintained we would require the commodity’s price to remain confined between the 57.90 (S1) support level and the 62.35 (R1) resistance line. On the other hand for a bullish outlook we would require a clear break above our 62.35 (R1) resistance level with the next possible target for the bulls being the 66.05 (R2) resistance line. Lastly, for a bearish outlook we would require a clear break below the 57.90 (S1) support level with the next possible target for the bears being the 53.75 (S2) support line.
免责声明:
This information is not considered investment advice or an investment recommendation, but instead a marketing communication. IronFX is not responsible for any data or information provided by third parties referenced or hyperlinked in this communication.


