

Since our last report ,Oil prices seem to have renewed their bearish tendencies since the start for the week. In today’s report we are to take a look at the shifting state of the US oil market, fundamental issues surrounding both the demand and supply side of the commodity and how they could affect its price and conclude the report with a technical analysis of WTI’s daily chart.
US oil market seems to be tightening, but…
In the US, signals for the local oil market were encouraging as on Friday Baker Hughes reported an increase of active oil rigs from 481 to 487. It should be noted that it’s the fourth consecutive increase of active oil rigs in the US signalling possibly an increase in oil demand, which could be interpreted as bullish for oil prices.
Furthermore on Tuesday API reported an unexpected decrease of US crude oil inventories by 0.6 million barrels. The release was followed EIA’s report the following day which also unexpectedly showed an even wider decrease of US crude oil inventories , this time of 2.332 million barrels.
On the other hand we have to note that fuel inventories seem to be piling up in the US in a signal that that the demand side is not able to absorb them. That last signal is exactly a point of worry for oil traders and tends to create substantial doubt about the tightness of the US oil market as implied by EIA’s and API’s drawdowns in US crude oil inventories.
Should we see additional signs of the US oil market tightening we may see the data providing some support for oil prices in the coming week.
Venezuela, Ukraine and OPEC+ on the supply side
On the supply side of the international oil market the most recent headlines highlight that US President Trump has revoked Chevron’s license to operate in Venezuela.
The US President cited a lack of progress by Venezuela to reform its electoral laws but also in accepting back migrants which were deemed as illegal in the US. The development may narrow the supply lines in the international oil market and is considered as bullish for oil prices. Furthermore we note OPEC’s efforts to keep the international oil market tight, by keeping oil production levels low.
Yet at the same time our worries tend to intensify that should the oil producing countries’ alliance continue in this modus vivendi it may risk a substantial market share in the international oil market, thus OPEC may also be experiencing pressure to start increasing its oil production levels.
Any signals to that end could have bearish implications for oil prices. Lastly on the supply side we note that the possibility of ending the war in Ukraine and thus an easing on the strain on the international oil supply chain, tends to provide some bearish tendencies for oil prices.
The same applies for any further signals of easing in the conflict in Gaza and the Middle East in general. On the other hand a possible escalation of pressure either diplomatically, military or trade wise on Iran in the coming week could be positive for oil prices.
Demand affected by US, Chinese economic outlook
Since our last report worries for the outlook of the US economy tended to intensify, especially for the demand side of the US economy, given also the Fed’s intentions to keep its monetary policy at restrictive levels, possibly for a longer period than what the market expects.
As these lines are written the revised US GDP rate for Q4 25 is still to be released and a possible acceleration could ease the market worries and vice versa. As the next key event that could affect oil prices we note the release of the ISM manufacturing PMI figure for February on Monday and indications of a faster expansion of economic activity in the US manufacturing sector could improve the demand outlook in the US economy thus having a possible bullish effect on oil prices.
The same applies for the Chinese economy, as a clear increase of economic activity in the Chinese manufacturing sector could enhance the outlook of oil demand on an international level and provide support for oil prices.
To that end we note the release of the NBS and Caixin manufacturing PMI figures for February on Saturday and Monday respectively. Overall, we tend to view the demand side of the international oil market maybe as dominant at the current stage.
Oil Technical Analysis
WTI Cash Daily Chart
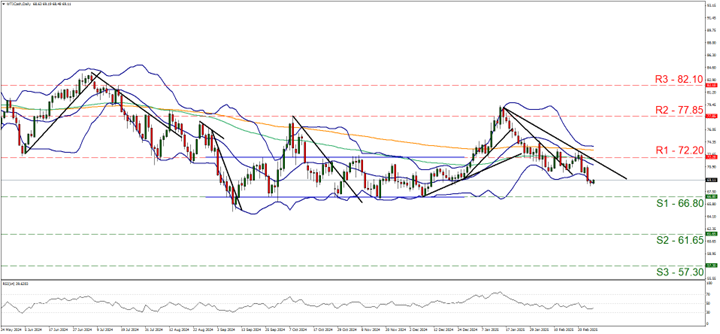
- Support: 66.80 (S1), 61.65 (S2), 57.30 (S3)
- Resistance: 72.20 (R1), 77.85 (R2), 82.10 (R3)
After some unsuccessful attempts to break clearly the 72.20 (R1) resistance line, WTI’s price turned decisively lower since the start of the week. In its motion the commodity’s price action formed a lower trough thus allowing us to shift the downward trendline to the right and renew our bearish outlook for WTI’s price. Please note that the RSI indicator is between the readings of 50 and 30 implying a bearish predisposition of the market for the commodity’s price.
On the other hand, WTI’s price action has hit on the lower Bollinger band, which in turn forced WTI’s price to stabilise over the past two days. We may see WTI’s price action even correcting higher , yet for the time being and as long as the downward trendline continues to lead WTI’s price action lower, we maintain our bearish outlook for WTI’s price.
Should the bears maintain control as expected, we may see WTIs’ price action, breaking the 66.80 (S1) support line, with the next possible target for the bears being set ant the 61.65 (S2) support base which has not seen any price action over the past three and a half years (since Aug 2021).
On the flip side should the bulls find a chance and take over ,we may see WIT’s price rising and reversing the losses of the past month, by initially breaking the prementioned downward trendline in a first signals of an interruption of the downward motion and continuing to clearly break the 72.20 (R1) resistance line. Even higher we note for the bulls the 75.65 (R2) resistance barrier.
免责声明:
This information is not considered investment advice or an investment recommendation, but instead a marketing communication. IronFX is not responsible for any data or information provided by third parties referenced or hyperlinked in this communication.


