

Oil prices have rapidly decreased over the past two days, with analysts citing weak demand factors. In this report, we aim to shed light on the factors driving WTI’s price, assess its future outlook, and conclude with a technical analysis of Crude.
Factors driving (Oil) WTI’s price
OPEC+ Ministerial Meeting.
An OPEC+ Ministerial meeting took place on Wednesday, in which the group made no changes to the group’s oil output policy, which may have provided support for the price of the commodity, yet that appears to have not materialized. Furthermore, following last week’s statements by Russia that they would be sticking to their original agreement with OPEC+ to reduce oil production, the liquid gold edged closer and closer to the $100 per barrel figure, but since the beginning of the week, it appears to have reversed trajectory and moved lower to levels last seen at the end of August 2023.
In addition, it appears that external factors such as demand may be mitigating the production cuts of OPEC+ such as demand side worries, which may be counteracting against the group’s aims of preserving oil prices at higher levels. Lastly, we personally believe that any attempt to increase oil production cuts from their current levels may be met with fierce opposition from nations who have repeatedly expressed discontent and a desire to increase oil production such as the UAE. Therefore, we believe that the group may not be able to cut production further and that the price of oil may be dictated by other factors. On the other hand, should the group announce further production cuts, we may see the commodity gaining support.
US seasonal gasoline demand slumps to levels last seen in 1998
During yesterday’s American session, the U.S. gasoline Inventories figure came in at 6.481M, a much greater increase in inventories than the expected figure of 0.161M. The greater-than-expected figure marks the lowest level in seasonal gasoline demand since 1998 according to Bloomberg. The implications of a reduction in demand could be that the high inflation rate and oil prices could greatly affect the disposable income of consumers. Furthermore, a reduction in demand could potentially reflect that the current prices of oil may not be sustainable and could be indicative of a deterioration in economic activity in the US. As a result, the reduction in demand seems to have heavily weighed on the price of the commodity, as concerns about a potential recession appear to be re-emerging, following a relatively quiet period of no major concerns of a major recession. However, we should note that despite current concerns emerging about the US economy, the reduction in demand could be temporary, and as such the current implications may be more of a short-term view.
The dispute between Turkey and Iraq over an oil pipeline continues
According to Bloomberg, International oil companies are stating that they are facing $1 billion in losses, as the dispute between Turkey và Iraq over a closure of a key crude export pipeline continues to be prolonged. A separate report by Reuters stated that Turkey was ready to restart the operation of the pipeline this week, yet it appears that may not be the case, as the issue over damages owed to Baghdad by Ankara still persists. Despite the current issues, the pipeline has already been closed for over 6 months and as such may not heavily influence the oil markets. However, should it be re-opened and the supply of oil into the international markets is increased, we may see the price of oil weakening. On the other hand, should the pipeline remain closed, we may see some support in the oil markets, yet we believe that in such an event, the potential support for the commodity’s price could be minimal.
Oil: Technical Analysis
WTI Cash Daily Chart
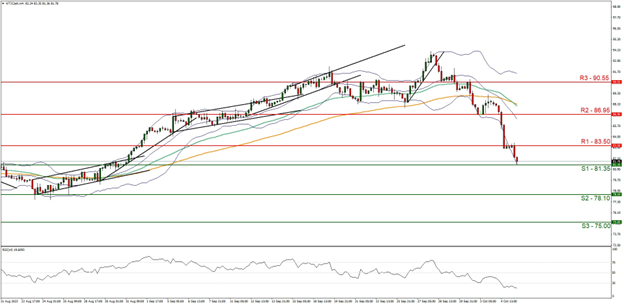
- Support: 81.35 (S1), 78.10 (S2), 75.00 (S3)
- Resistance: 83.50 (R1), 86.95 (R2), 90.55 (R3)
Oil’s upward movement was interrupted, since last week with the commodity now having dropped below the $85 per barrel psychological figure and is now aiming for the 81.35 (S1) support level. We maintain a bearish outlook for the commodity and supporting our case is the RSI indicator below our 4-Hour chart which is currently registering a figure near 30, implying a strong bearish market sentiment.
For our bearish outlook to continue, we would like to see a clear break below the 81.35 (S1) support level if not also the 78.10 (S2) support line, with the next possible target for the bears being the 75.00 (S3) key psychological support base. On the other hand, for a bullish outlook we would like to see a clear break above the 83.50 (R1) resistance level, with the next possible target for the bulls being the 86.95 (R2) resistance ceiling. We would also like to highlight that the Bollinger bands have widened significantly, implying high market volatility.
Disclaimer:
This information is not considered investment advice or an investment recommendation, but instead a marketing communication. IronFX is not responsible for any data or information provided by third parties referenced or hyperlinked, in this communication.


