
WTI continued moving lower for the 3rd week in a row. Prospects for future demand and production levels appear to be at the forefront in guiding the market sentiment and oil prices. In this report, we aim to shed light on the factors driving WTI’s price, assess its future outlook and conclude with a technical analysis.
China’s economic data continues to keep oil traders up at night
China’s Industrial production came in lower than anticipated on a yoy basis for May, adding to China’s trade balance woes since last Wednesday. The continued deterioration in the world’s largest oil guzzling giant, appears to be taking a heavy toll on demand for oil, as it appears that Chinas initial re-opening momentum appears to be rapidly losing momentum. Furthermore, in an attempt to recoup previous growth rates, the People’s Bank of China reduced the rate on their own year-loans after lowering their short-term rates earlier this week. The reductions appear to be aimed at rejuvenating ailing industries such as the property industry which plays an important role in China’s economic activity. In addition, the State Council according to Bloomberg, is expected to discuss further stimulus packages aimed to boost the ailing industries and increasing consumer spending in the economy, in an attempt to boost economic growth. In conclusion, financial releases stemming from China, paint a worrying picture for the global demand of oil, as the world largest importer of oil appears to be experiencing a decline in economic activity, thus potentially weakening demand for oil which in turn, may be driving oil prices to lower ground.
Oil traders seem unfazed following the Feds interest rate decision
Oil traders may have been hoping that a hawkish pause by the Fed would have supported oil prices, as the pause may provide some breathing room for oil markets that have been feeling the brunt of lower oil demand due to reduced economic activity. However, it would appear that despite the Fed remaining on pause during yesterday’s FOMC meeting, oil prices still moved lower, as the hawkish outlook by Fed Chair Powell seemed to take the spotlight after stating that rate cuts are “a few years out”. The statements made by the Fed Chair seem to have weakened the resolve of oil traders, as the noose around the economy does not appear to be loosening any time soon, but may rather further tighten, thus hindering potential growth which may have reduced demand for oil, which in turn could have reduced oil’s price.
OPEC monthly report temporarily boosts oil prices
The OPEC monthly report was released on Tuesday, which stated that the world economic growth forecasts in addition to the world oil demand have both remained unchanged. The report also seems to be contradicting market worries of a recession, as it is predicted by the group that oil demand from China is anticipated to rise from 800,000 bpd to 840,000 bpd, which may support oil’s price through increased demand. Furthermore, global oil demand appears to have remained the same as was mentioned above, with global demand expected to rise by 2.4%. Lastly the report highlighted that the group reduced oil production in May, which reflected prior output cuts pledges made by members. Overall, the monthly report appears to have temporarily supported iil’s price at the time of its release, yet the statements about rising uncertainties regarding global economic growth, seem to be evident amongst oil producers and traders and may have hindered potential oil gains.
Phân tích kỹ thuật
WTI Cash 4H Chart
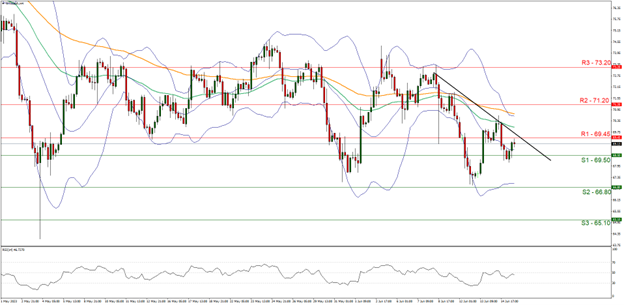
- Support: 69.50 (S1), 66.80 (S2), 65.10 (S3)
- Resistance: 69.45 (R1), 71.20 (R2), 73.20 (R3)
WTI seems to be continuing it’s downwards trajectory for a 3rd week in a row, having formed a downwards moving trendline which was incepted on the 8th of June, as market worries of a recession seem to be heightened. We tend to maintain a bearish outlook for oil as it has broken below support now turned resistance at 71.20 (R2) and supporting our case is the downwards moving trendline, in addition to the RSI indicator below our 4-Hour chart currently registering a figure below 50, implying a bearish market sentiment. For our bearish outlook to continue, we would like to see a clear break below support at 69.50 (S1), with the next possible target for the bears being the 66.80 (S2) support base. On the other hand, for a bullish outlook, we would like to see a clear break above resistance at 69.45 (R1) with the next potential target for the bulls being the 71.20 (R2) resistance ceiling. However, we note that the widening of the Bollinger bands imply high market volatility and as such, may impact oil’s price movement, as it is currently in the mid-range of the bands.
Disclaimer:
This information is not considered investment advice or an investment recommendation, but instead a marketing communication. IronFX is not responsible for any data or information provided by third parties referenced or hyperlinked, in this communication.


