Gold’s price moved lower over the past week, we intend to lay out the main fundamental challenges for the precious metal, including the recent tensions in the Middle East between Israel and Hezbollah, the release US employment report for September last Friday, and the upcoming US CPI rates on Thursday. We will be concluding this report with a technical analysis of gold’s daily chart.
Middle East tensions still remain volatile
The tensions in the Middle East remain apparent, with Israel announcing on Tuesday that it has expanded its ground operations in the Southern region of Lebanon, which may pave the way for a further escalation between Israel and Hezbollah as a fourth division has now been deployed to the area. According to some media outlets, the total number of Israeli soldiers operating in Southern Lebanon may have exceed the 15,000 amount and may widen Israel’s ground operations in the area.
However, the main concern in the region appears to be the widely anticipated retaliation of Israel against Iran and as a reminder, the WSJ had reported last week that Israel warned Iran, “that in the event of any strike on its territory “no matter how small or large and that it didn’t matter if there were casualties or not.. Israel.
Would directly hit Iran’s nuclear or oil facilities”. The issue is so sensitive that following a recent earthquake near an Iranian nuclear facility, some unfounded theories have emerged that Iran was testing a nuclear bomb.
Nonetheless, should Israel retaliate against Iran by striking its critical infrastructure within its territory, market worries about a potential regional war may intensify and thus could lead to inflows into the precious metal given its status as a safe haven asset. On the flip side, should we see measures being taken to de-escalate the situation it may have the opposite effect on the precious metal’s price.
US September CPI rates the next big test for Gold traders
The US employment report for September which was released last Friday tended to weigh on gold’s price. The unemployment rate came in lower than expected at 4.1% versus the expected rate of 4.2%, in addition the NFP figure came in much higher than expected at 254k versus the expected figure of 147k, whilst the average earnings growth rate increased to 4%yoy.
Overall, the US employment report for September came in hotter than expected, implying a resilient labour market which in turn appears to have aided the USD whilst weighing on gold’s price, as it may imply that the Fed may need to refrain from aggressively easing their monetary policy stance. Nevertheless, the next big test for gold traders may be the release of the US CPI rates on Thursday which are anticipated to showcase easing inflationary pressures in the US economy.
In particular, the headline rate on a year-on-year basis is expected to slow down from 2.5% to 2.3%, which may further amplify the soft-landing scenario for the US economy. Hence, should the CPI rates for September come in as expected or lower and thus imply easing inflationary pressures in the US economy, it may provide the Fed with some greater leeway should they decide to continue on their monetary policy easing cycle and thus weigh on the greenback whilst aiding the precious metal’s price given their inverse relationship with one another. On the flip side, should the CPI rates come in hotter than expected, it may have the opposite effect on the precious metal’s price.
Gold Technical Analysis
XAUUSD Daily Chart
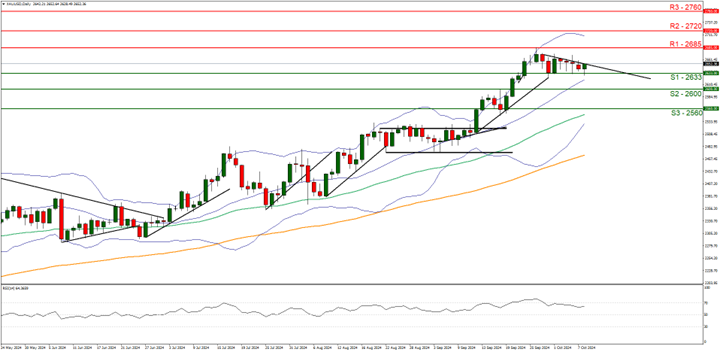
- Support: 2633 (S1), 2600 (S2), 2560 (S3)
- Resistance: 2685 (R1), 2720 (R2), 2760 (R3)
Gold’s price seems to have hit a ceiling near the 2685 (R1) resistance line and has since moved lower. We tend to opt for a bearish outlook for the precious metal’s price and supporting our case is the downwards moving trendline which was incepted on the 27th of September.
Yet the RSI indicator below our chart currently registers a figure above 60, implying a bullish market sentiment. Nonetheless, for our bearish outlook to continue we would require a clear break below the 2633 (S1) support level with the next possible target for the bears being the 2600 (S2) support base.
On the flip side for a bullish outlook, we would require a clear break above the 2685 (R1) resistance line with the next potential target for the bulls being the 2720 (R2) resistance level. Lastly, for a sideways bias we would require the commodity’s price to remain confined between the sideways moving channel defined by the 2633 (S1) support line and the 2685 (R1) resistance level.
Disclaimer:
This information is not considered investment advice or an investment recommendation, but instead a marketing communication. IronFX is not responsible for any data or information provided by third parties referenced or hyperlinked in this communication.


