

Gold’s price continued to drop slowly yet steadily, over the past week with the overall sideways motion picture changing. The slight gains of the USD in the past week seem to have activated gold’s bears given also the recent financial releases and monetary policy events. In this report, we aim to shed light on the catalysts driving the precious metal’s price, assess its future outlook and conclude with a technical analysis.
Fed’s hawkishness maintained
The role of US Yields and the next tests
On second note, we would also note the course of US yields as over the past weekend, yields tended to be on the rise, yet since Monday have corrected lower. Should we see US yields restart and maintain a clear upward trajectory, both for medium and longer-term bonds, we may see gold prices being set under selling pressure as bonds would become more attractive investment destinations given that gold is not interest-bearing. We note as the next big test for gold prices the planned speech of Chair Jerome Powell on Wednesday. Should the Fed Chairman sound more hawkish than the market’s expectations we may see the USD gaining while on the flip side that may weigh on gold’s price given that the negative correlation of the USD and gold prices is maintained. Furthermore we would note the release of the final US GDP rate for Q1 on Thursday as well as the US consumption rate for May and the Core PCE price index for the same month.
Asian demand for gold mixed
Last but not least we note that demand for physical gold from Asia seems to be muted especially from China, given the headwinds the Chinese economy is currently facing. Furthermore, we note the Chinese Dragon Boat festival that may have kept buyers away for the past week. On the other hand, reports surfaced that demand for physical gold is rising in India, with traders selling gold at a premium. Also an increase of footfall in local retail jewellery stores is reported. Gold traders are hoping that the easing of demand in China may be countered by an increase in India.
Technical Analysis – Gold
XAUUSD H4 Chart
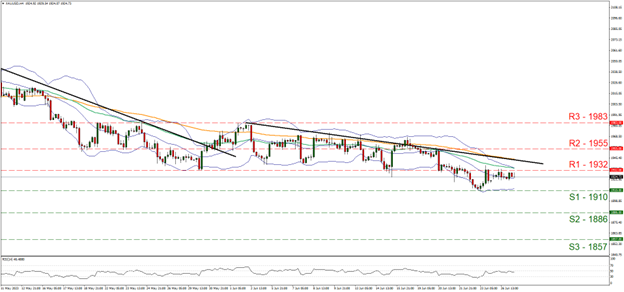
- Support: 1910 (S1), 1886 (S2), 1857 (S3)
- Resistance: 1932 (R1), 1955 (R2), 1983 (R3)
Gold’s price continued its downward trajectory as it broke the 1932 (R1) support line, now turned to resistance. It’s characteristic that the R1 has already proven its worth as a resistance line preventing gold’s price to reascent higher. At the same time, we note that the RSI indicator remains near the reading of 50 implying a rather indecisive market. Given the continuous downward movement and the existence of a downward trendline guiding the precious metal, given also the limited upside potential for gold’s price currently, we tend to maintain on a technical level a bias for the bearish movement to continue.
Should the bears actually maintain control over the precious metal, we may see its price breaking the 1910 (S1) support line and aim for the 1886 (S2) support level. For a bullish outlook, we would require the price action of gold to initially break the 1932 (R1) resistance line and the prementioned downward trendline, signaling the interruption of the bearish movement, but also we would require gold’s price to reach if not breach the 1955 (R2) resistance hurdle before calling in the bulls.
Disclaimer:
This information is not considered investment advice or an investment recommendation, but instead a marketing communication. IronFX is not responsible for any data or information provided by third parties referenced or hyperlinked, in this communication.


