
There seemed to be relatively low volatility for oil prices since last week’s report. In the current report, we intend to have a look at the state of the US oil market, the role of the USD in determining oil prices and the possible implications of OPEC+’s meeting on Sunday. To conclude the report we will also provide a technical analysis of WTI’s daily chart
Uptick in demand from the US oil market
We start our analysis of the US oil market by having a look at the release of the Baker Hughes oil rig count. The release indicated that the number of active oil rigs in the US have remained steady which may imply that demand for oil has been maintained. Furthermore, on Wednesday, the API weekly crude oil inventories figure, showcased a drawdown of -6.490 million barrels. The reversal from a pileup in inventories last week, to a drawdown in inventories, may imply that demand for oil from US consumers has increased.
Hence, with the drawdown figure also vastly exceeding market expectations, it may have provided some support for oil prices. Thus, attention now turns to the release of the EIA weekly crude oil inventories figure later on today. The current market expectations are for the EIA figure to also indicate a withdrawal of -1.600 million barrels, which would coincide with the API’s uptick in oil demand since last week. Therefore, should the figure come in as expected or lower, it may provide support for oil prices. Whereas, should it come in lower than expected, it could weigh on oil prices.
Fed’s gauge for inflationary pressures, due out on Friday.
Another issue we would like to address is the release of theUS Core PCE rate on Friday, which is the Fed’s favourite tool for measuring inflationary pressures. The current expectations by analysts are for the Core PCE rates for April to remain steady at 2.8% on a year-on-year level and at 0.3% on a month-on-month basis, thus implying persistent inflationary pressures in the US Economy.
As such should the rates come in as expected, or even higher which would imply an acceleration of inflation in the US economy, it could force the Fed’s hand to maintain its current restrictive monetary policy stance for a prolonged period of time. The implications of the Fed maintaining interest rates higher for longer, could result in tighter financial conditions surrounding the US economy, which in turn could hamper oil demand.
Therefore, the implications of tight financial conditions for longer, could also have an adverse impact on oil prices, as the possibility of a reduction in demand for oil , may weigh on oil prices. In conclusion, should the US Core PCE rates come in as expected, hence showcasing stubborn inflationary pressures, it could weigh on oil prices. On the flip side, should the release imply easing inflationary pressures in the US economy, it could provide support for oil prices.
OPEC+ meeting on Sunday.
We make a start with our OPEC comment by noting that the group of oil-producing economies is set to meet on June 2nd which is this Sunday, via conference call. A rollover of the production cuts seems to be the predominant scenario currently, a view which we tend to agree with. We believe that the extension of the cartel’s voluntary oil production cuts, may worsen the rifts that appear to be emerging within the members of the organization. In particular, the division between the UAE, Iraq, Kuwait, and Algeria who were scrutinized by the rest of the bloc for their oil production capacities.
Therefore, we do not anticipate further oil production cuts, as a report by Bloomberg on the 14th of May quoted one of it’s sources as saying that “Some have pushed for an upward revision”, when referring to oil production levels. Therefore, should the bloc maintain its current output commitments intact, it could weigh on oil prices. However, a surprise move by the cartel to increase their voluntary oil production cuts could significantly support oil prices.
การวิเคราะห์เทคนิค (Kār wịkhrā h̄l tēkhnịk)
WTI Cash Daily Chart
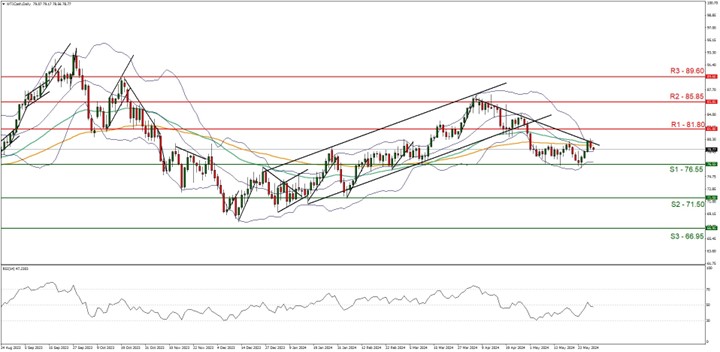
- Support: 76.55 (S1), 71.50 (S2), 66.95 (S3)
- Resistance: 81.80 (R1), 85.85 (R2), 89.60 (R3)
WTICash appears to be moving in a downwards trajectory, with the commodity’s price having formed a downwards-moving trendline, incepted on the 5th of May. However, at this point we would like to point out the divergence between our RSI indicator and oil’s price action. In particular, when the price action of WTI’s price formed a new lower low on the 23rd of May, the RSI indicator formed a new higher low. The divergence may be a first signal that the commodity’s short-term price direction may be shifting away from it’s downwards trajectory and that the bulls maybe gearing up to enter the picture. Furthermore, the RSI indicator at the time of this report has also rebounded from the figure of 30 to 50, implying that the bearish momentum is fading away.
As such, we would opt for a sideways bias for the commodity’s price, at least on a shorter time basis. Hence for our sideways bias to occur, we would require the commodity’s price to fail to break below the 76.55 (S1) support level and remain within the sideways channel defined by the 76.55 (S1) support level and the 81.80 (R1) resistance level. On the flip side, for a bearish outlook ,we would require a clear break below the 76.55 (S1) support level, with the next possible target for the bears being the 71.50 (S2) support base. Lastly, for a bullish outlook we would require a clear break above the downwards-moving trendline, as a first signal that the downwards movement may be interrupted, in addition to a clear break above the 81.80 (R1) resistance line with the next possible target for the bulls being the 85.80 (R2) resistance level.
Disclaimer:
This information is not considered investment advice or an investment recommendation, but instead a marketing communication. IronFX is not responsible for any data or information provided by third parties referenced or hyperlinked, in this communication.


