
Gold at the time of this report, seems to be moving in an upwards fashion, with gold last week report marking the precious metals fastest ascent in the last 7 months for a weekly timeframe. We note the high volatility in the gold market, as tensions in the Middle East appear to continue rising, with the risk of a regional conflict, may keep volatility elevated until the current conflict is resolved. In this report, we aim to shed light on the catalysts driving gold’s price, assess its future outlook and conclude with a technical analysis.
Tensions in the Middle East tend to persist.
Over the weekend, regional tensions appear to have been elevated in the Middle East, as the soundness and the stability of the region, is called into question. This was evident during last week, with the precious metal had its best rally for the week, in the past 7 months. Furthermore, the continued escalation of Geopolitical tensions which carry the risk of spilling into a regional confrontation, may maintain the high level of volatility in the commodities markets.
The high levels of volatility could provide support to the commodities markets and in particular gold, which is considered to be a safe haven asset. Therefore, precious metal’s safe haven status seems to be funneling inflows, as market participants may be concerned about the duration of this conflict. In addition, the potential risks associated should external actors enter the ongoing conflict, could potentially add fuel to the precious metal’s ascent, as the potential widening of the conflict, could have long lasting geopolitical implications in the region.
However, we would like to highlight that should the conflict be resolved, we may see the precious metal weakening, as the markets return to normal. Yet, that does not appear to be the case for now. In conclusion, the elevated risks of a regional conflict may provide support to the precious metal yet should tensions subside we may see the precious metal ceding ground. In our opinion, we anticipate heightened market volatility for the rest of the week, which may aid to golds ascent.
US Financial releases take a back seat.
Financial releases stemming from the US have traditionally impacted the precious metal, given the greenback’s and gold’s inverse relationship with one another. The divergence is their traditional relationship was seen last week, where the dollar appreciated against its counterparts, whilst the precious metal gained as well. Nonetheless, financial releases stemming from the US could still impact the precious metal. As such, following last week’s Philly Fed Consumer confidence figures, which showed expectations for current conditions to deteriorate whilst inflationary pressures remain high in the future. Thus, essentially implying that consumers are anticipating a stagflation scenario.
As a result, traders may be interested in this week’s Philly Fed manufacturing index figure for October and the Existing home sales figure for September. In the event that the figures come in lower than expected, hinting at a deterioration in economic activity, we may see the precious capitalizing on a weaker dollar. Whereas, in the event that they come in higher than expected, we may see the precious metal ceding some control to a stronger dollar.
Gold – Technical Analysis
XAUUSD 4-Hour Chart
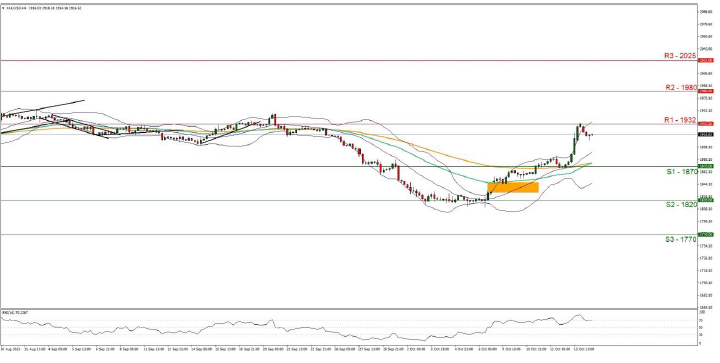
- Support: 1870 (S1), 1820 (S2), 1770 (S3)
- Resistance: 1932 (R1), 1980 (R2), 2025 (R3)
The precious metal appears to be moving in an upwards fashion. We maintain a bullish outlook and supporting our case is the RSI indicator below our 4-Hour Chart which currently registers a figure at 70, implying a strong bullish market sentiment. For our bullish outlook to continue, we would like to see a clear break above the 1932 (R1) resistance level, with the next possible target for the bulls being the 1980 (R2) resistance ceiling.
On the other hand, for a bearish outlook, we would like to see a clear break below the 1870 (S1) support level, with the next possible target for the bears being the 1820 (S2) support base. Lastly, for a neutral outlook, we would like to see the commodity remaining confined between the 1870 (S1) and the 1932(R1) support and resistance levels respectively. Moreover, the continued widening of the Bollinger bands imply high market volatility and as such we may see volatile price swings in either direction.
Disclaimer:
This information is not considered investment advice or an investment recommendation, but instead a marketing communication. IronFX is not responsible for any data or information provided by third parties referenced or hyperlinked, in this communication.


