

WTI prices started rising since our last report, yet the overall movement is still unconvincing for the bulls’ intentions. In the current report we intend to have a look at the state of the US oil market, yet also on an international level, discuss factors on the demand and supply sides that drive oil prices. To conclude the report we will also provide a technical analysis of WTI’s daily chart.
Mixed signals for the US oil market
The metrics related to the US oil market tended to provide mixed signals since our last report. Characteristically the Baker Hughes oil rig count for the prior week, dropped by seven active oil rigs, from 506 to 499, in a sign of easing oil demand in the US oil market.
Furthermore on Tuesday the API weekly crude oil inventories figure was released, showing an increase of US oil inventories by slightly more than half a million barrels, in another possible signal of easing oil demand in the US oil market.
Yet both were contradicted by the release of the EIA crude oil inventories report that showed a drawdown of -1.362 million barrels. The drawdown was narrower than expected, yet totally reversed the picture of a slack in the US oil market in the past weeks as an increase of 7.3 million barrels was reported the week before.
Overall the EIA release in contrast to API tended to imply that aggregated oil demand in the US, surpassed oil production levels, and implied a relative tightness at the current stage. Should we see the indicators aligning in the coming week implying a tightness in the US oil market we may see WTI’s price getting a boost.
China’s demand outlook improves
On the international demand side, China seems to be regaining some ground. There were extensive reports for a rise in Chinese oil imports last month.
According to Reuters, Crude imports in April totalled 44.72 million metric tons, or about 10.88 million barrels per day (bpd), according to data from the General Administration of Customs. That represented a 5.45% increase from the relatively low 10.4 million bpd imported in April 2023.
The increased demand for oil was also accompanied by improved trade data for the same month, as China’s trade balance rose from US$58.55 billion in March to US$72.35 billion in April. In addition to that, both the import and export growth rates escaped negative territory showing expansion, in different degrees.
Should the two be combined it could lead to the assumption that healthy increased economic activity lead to higher demand for oil in China allowing for a more optimistic outlook for the Chinese oil demand in the future which could support oil prices in the coming week, should additional clues point to that direction.
Tensions in the Middle East
On the supply side of the international oil market we tend to note the rising tensions in the Middle East as a possible factor that could strain the supply chains for the commodity.
The first issue would be the Houthi actions as they were reported to have been targeting ships in the Gulf of Aden. The two attacks are reported to have been made against Panama flag container ships yet seem to have caused no damage.
Yet the key take away is that the Houthis are once again targeting passing ships threatening a key oil supply route and market worries for a possible additional strain on oil supply, could start supporting oil prices. It should be noted that the Houthis insist their assaults on shipping through the crucial waterway leading to the Suez Canal and onward to the Mediterranean Sea will continue as long as the war goes on, as reported by ABC, thus the issue is characterised as ongoing and hot for oil traders.
The second issue in the region would the assault of Israel of the Rafah region of the Gaza strip. Despite US President Biden warning Israel for a possible stop in US bomb and artillery shell shipments, the Israelis seem to be determined to proceed with a military operation in Rafah.
Overall tensions seem to be on the rise over the Gaza strip and negotiations for a ceasefire in Cairo, Egypt, tend to remain fruitless for the time being.
A major Israeli military operation, could cause thousands of victims and if that’s the case, then we may see reactions not only by Hamas but by Iran itself for a second time. Such a direct involvement of Iran would signal an escalation to another level for the conflict and could provide also support for oil prices.
การวิเคราะห์เทคนิค (Kār wịkhrā h̄l tēkhnịk)
WTI Cash Daily Chart
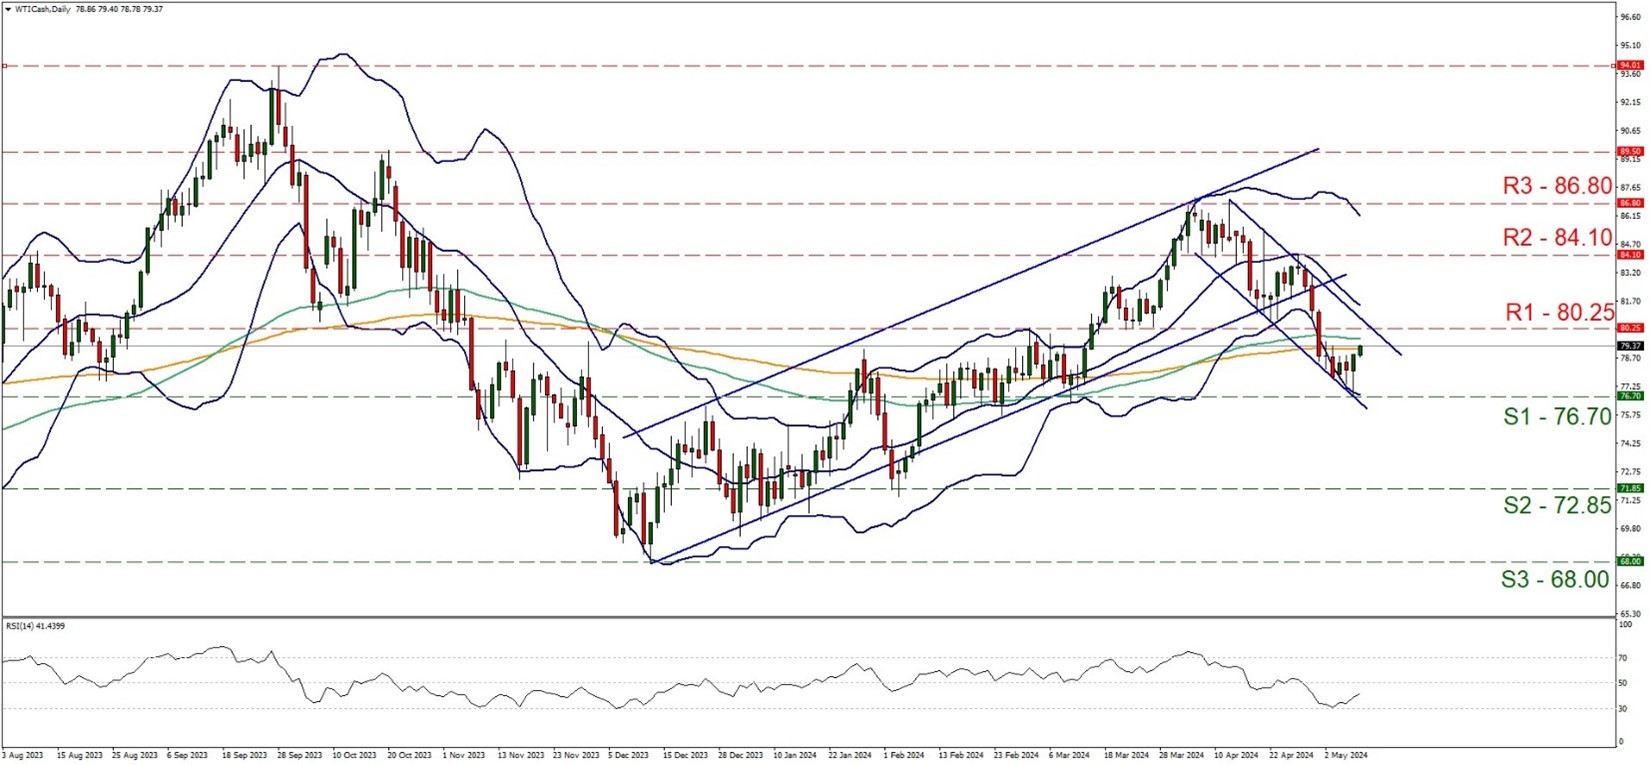
- Support: 76.70 (S1), 72.85 (S2), 68.00 (S3)
- Resistance: 80.25 (R1), 84.10 (R2), 86.90 (R3)
WTI’s price bopunced on the 76.70 (S1) support line yesterday and corrected higher. Yet the rise of the commodity’s price as viewed from our side as a mere correction higher given that the RSI indicator had reached as low as the reading of 30 before bouncing, while the price action also bounced on the lower boundary of the downward channel currently leading the commodity’s price action.
Further more we note that the correction higher, was marked after the price action’s flirt with the lower Bollinger Band, creating some new room for the bears to play. It should be noted though that the RSI indicator has risen yet is still below the reading of 50, implying an easing of the bearish sentiment.
Overall we tend to maintain a bearish outlook for the commodity’s price action, as long as its price action remains within the corridor set by the prementioned downward channel. Should the bears actually remain in charge of the commodity’s direction, we would expect it to form a new lower low, hence we may see it breaking the 76.70 (S1) support line, thus opening the gates for the 72.85 (S2) support barrier.
For a bullish outlook, we would require WTI’s price action to break the upper boundary of the current downward channel, signalling an interruption of the downward movement, breaking the 80.25 (R1) resistance line clearly and start aiming for the 84.10 (R2) resistance hurdle.
Disclaimer:
This information is not considered investment advice or an investment recommendation, but instead a marketing communication. IronFX is not responsible for any data or information provided by third parties referenced or hyperlinked, in this communication.


