

Gold’s price appears to have moved lower since on last report, following signs of easing tensions between Israel and Iran. Today we are to discuss the fundamental challenges laid ahead for the precious metal, while we will be concluding this report with a technical analysis of gold’s four hour chart.
Iran-Israel tensions subside.
Following, Iran’s Aerial assault during the late hours of Saturday the 13th, in which Iran fired more than 300 drones and missiles, Israel retaliated last week, yet opted for the bare minimum, in a move seen as an attempt to de-escalate tensions. In particular, on the morning of Friday the 19th, Israel responded by attacking a military installation on Iranian soil, but as we mentioned before, used the bare minimum in its arsenal.
The limited strike, in addition to the opting of Israel to avoid Iran’s capital Tehran, appears to have been widely interpreted as a show of force by Israel whilst allowing Iran to save face and thus preventing a tit-for-tat exchange of retaliatory strikes. Therefore, with media outlets and military theorists seemingly agreeing that both sides appear to be done with this round of barrages, gold may have seen safe haven outflows, which in turn may have weighed on the precious metal’s price.
Moreover, the theory of easing tensions appears to have been enhanced according to the Guardian, following the comments made by a Senior Iranian official who stated that there were “no plans for retaliation”, which may have de-escalated the tensions in the region. However, the breach of the decades-long “shadow war”, after both countries directly attacked each other’s territory could set a dangerous precedent for future “conflicts” which in our view increase the risk of a full-blown war between Israel and Iran rather than a proxy war. In conclusion, gold’s price may be weighed down from safe haven outflows for now.
US Financial releases and their impact on Gold’s price.
The US Philly Fed Manufacturing Index figure for April which was released last Thursday tended to imply that from the manufacturing side, the business prospectus of the US economy is rapidly improving with the figure vastly exceeding economists’ expectations by coming in at 15.5 versus the expected figure of 1.5 and the previous figure of 3.2, in a sign of economic resilience.
The uptick in manufacturing could provide the Fed with some leeway should they decide to keep interest rates higher for longer, as the US economy appears to be absorbing the impacts of the Fed’s restrictive monetary policy. Furthermore, the Atlanta Fed GDPNow Preliminary rate for Q1 came in better than expected at 2.9%, which may increase confidence in the Fed that keeping interest rates higher for longer, may not induce a recession in the US economy.
Therefore, the releases appear to have allowed for an enhanced hawkish narrative from Fed policymakers. In particular, Fed Chair Powell stated last Tuesday, that it will take “longer than expected” when referring to bringing down inflation to the bank’s 2% target, and most noticeably, Chicago Fed President Goolsbee who despite being widely known as a “dove”, stated on Friday that progress in combating inflation has “stalled”.
Overall, should financial releases stemming from the US continue to provide leeway for the Fed to maintain their restrictive monetary policy it could prove support for the dollar, whilst potentially weighing on Gold’s price.
The next potential hurdle could be the release of the Preliminary US GDP rate for Q1 on Thursday which is expected to decelerate to 2.4% and the Fed’s favourite tool for measuring inflationary pressures in the US economy which is the Core PCE rate for March on Friday.
Hence with the Core PCE rate for March anticipated to come in at 2.7%, it could dampen the Fed’s intensified hawkish rhetoric should it come in as expected or lower, thus weakening the greenback whilst allowing the precious metal to move higher. Whereas should it come in higher than expected implying that inflation may be entrenched in the US economy, which could amplify the hawkish rhetoric emerging from Fed policymakers, thus aiding the greenback whilst weakening gold’s price.
การวิเคราะห์เทคนิค (Kār wịkhrā h̄l tēkhnịk)
XAUUSD H4 Chart
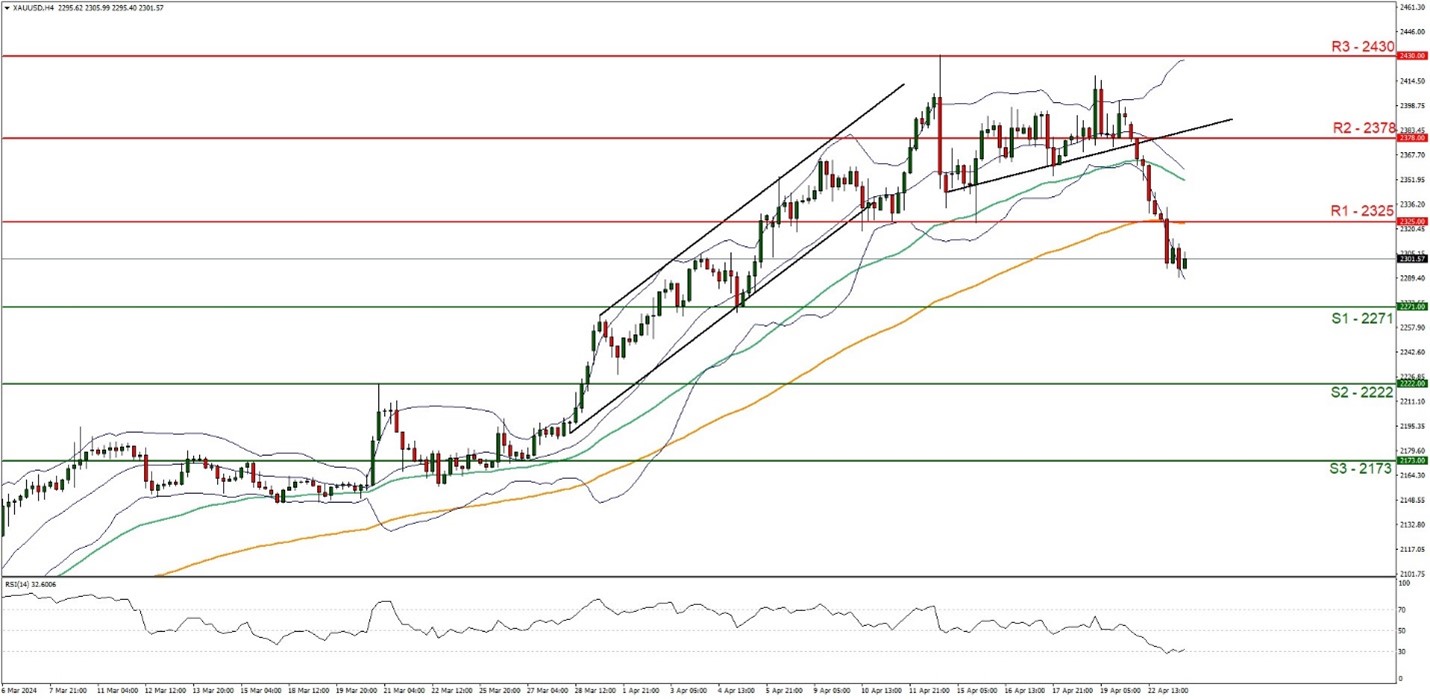
- Support: 2271 (S1), 2222 (S2), 2173 (S3)
- Resistance: 2325 (R1), 2378 (R2), 2430 (R3)
Since our last report, the bears appear to have taken the reigns of the direction of gold’s price, with the precious metal now seemingly on a downward trajectory. We maintain a bearish outlook and supporting our case is the RSI Indicator below our chart which currently registers a figure near 30, implying a strong bearish market sentiment, in addition to the Bollinger bands which have widened significantly, implying high market volatility. For our bearish outlook to continue, we would require a clear break below the 2271 (S1) support level, with the next possible target for the bears being the 2222 (S2) support base.
On the flip side, for a sideways bias, we would require the commodity to remain confined between the sideways channel defined by the 2271 (S1) support level and the 2325 (R1) resistance line. Lastly, for a bullish outlook, we would require a clear break above the 2325 (R1) resistance line, with the next possible target for the bulls being the 2378 (R2) resistance level.
Disclaimer:
This information is not considered investment advice or an investment recommendation, but instead a marketing communication. IronFX is not responsible for any data or information provided by third parties referenced or hyperlinked, in this communication.


