

Gold’s price seems to be edging higher after forming a new all-time high figure of $2266 per ounce, since our last report. Today we are to discuss the fundamental challenges laid ahead for the precious metal, while we will be concluding this report with a technical analysis of gold’s daily chart.
US Financial releases and their impact on Gold’s price
The US Core PCE rates released on Friday tended to imply easing inflationary pressures in the US economy. The year-on-year rate, as well as the month-of-month rate came in at 2.8% and 0.3%, respectively, thus appearing to be in line with the Fed’s expectations, as was stated by Fed Chair Powell on Friday. Following the release, the narrative for the Fed to maintain current interest rate levels, higher for longer may have been weakened, as the Fed’s restrictive monetary policy appears to be bearing some fruit and thus may have weighed on the dollar.
In turn, the precious metal may have capitalized on a weaker greenback and moved higher. However, we should that Fed Chair Powell’s comments were also slightly hawkish in nature, with Fed Chair Powell also stating that the Fed doesn’t need to be in a hurry when referring to cutting interest rates. Therefore, potentially limiting the precious metals ascent, as it may imply that the Fed could keep interest rates higher for longer.
Moreover, the precious metal’s ascent appears to have been hindered by the release of the US ISM and S&P Manufacturing PMI figures for March which implied that the US manufacturing industry expanded and thus the US economy remains resilient. The implied manufacturing expansion may have alleviated some of the downwards pressures faced by the greenback the past few days and thus seemed to have weighed on gold’s price following their release.
Tensions in the Middle East flare up again
On Monday the 1st of April, an airstrike struck the consular section of Iran’s embassy in Damascus and resulted in the death of two Iranian Generals according to various media outlets. Moreover, Iran has publicly blamed Israel for the attack which appears to be a significant escalation in hostilities between the two nations should it be confirmed that Israel was behind the attack.
Furthermore, Tehran’s ambassador to Syria, stated according to the FT that between five and seven Iranian diplomats and military advisers had been killed in Monday’s airstrike and that Iran’s response would be delivered “at the appropriate time and place”. Therefore, the potential risk of a retaliatory strike by Iran, could further destabilize the region and thus may support gold’s price given its status as a “ safe haven” asset.
Yet, at the time of this report, the aforementioned retaliatory strike by Iran has not occurred, although the possibility of a retaliation by Iran appears to be already influencing gold’s price.
Gold and US Yields
Since our last report, gold’s price edged higher, but so did the USD, which seems to have strengthened against its counterparts, thus highlighting a continuance in the divergence between the two trading instruments. As such we turn our attention to the increase of US yields since our last report which could have weighed on gold’s price, yet did not do so, despite US bonds being a more attractive alternative to gold as an investment given their interest-bearing status.
Upcoming financial releases
We highlight as the next big test for the USD the release of the US Employment data for March on Friday. Should the US Employment data showcase a resilient labour market, then pressures on the Fed to maintain interest rates higher for longer, could intensify and thus support the dollar whilst weighing on the precious metal. On the other hand, should the employment data imply a loosening labour market, it could weigh on the dollar which may allow the precious metal to move higher by capitalizing on a potentially weaker dollar.
Gold: Technical Analysis
XAUUSD Daily Chart
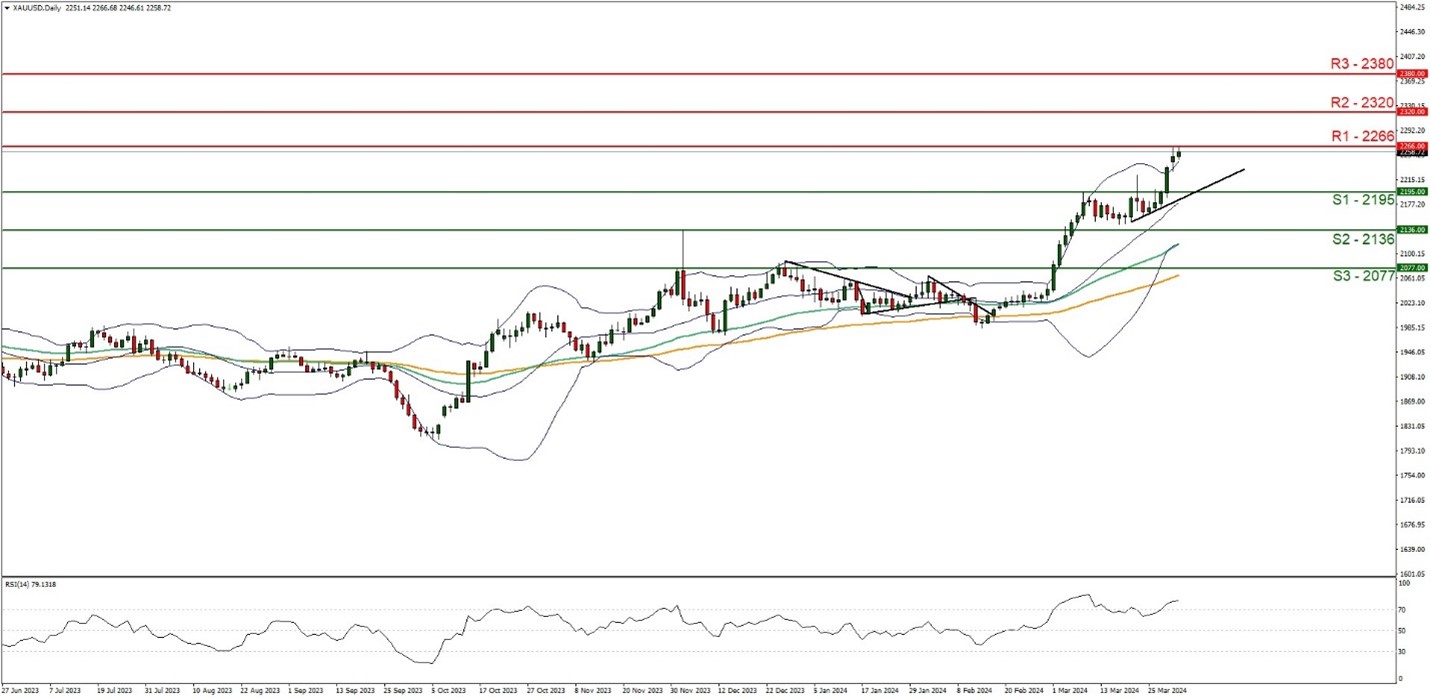
- Support: 2195 (S1), 2136 (S2), 2077 (S3)
- Resistance: 2266 (R1), 2320 (R2), 2380 (R3)
Since our last report, gold has formed a new all-time high figure around the $2266 per ounce figure. We maintain a bullish outlook for the precious metal and supporting our case is the RSI indicator below our chart which currently registers a figure near 80, implying a strong bullish market sentiment in addition to the upwards moving trendline which was incepted on the 20th of March.Yet, the RSI indicator being above 70 also may imply that the precious metal is in overbought territory and may be due a market correction to lower ground.
Nonetheless, for our bullish outlook to continue, we would require a clear break above the 2266 (R1) resistance line, with the next possible target for the bulls being the 2320 (R2) resistance level. On the other hand, for a sideways bias we would like to see the precious metal remain confined between the 2195 (S1) support level and the 2266 (R1) resistance line. Lastly, for a bearish outlook, we would require a clear break below the 2195 (S1) support level with the next possible target for the bears being the 2136 (S2) support line.
Disclaimer:
This information is not considered investment advice or an investment recommendation, but instead a marketing communication. IronFX is not responsible for any data or information provided by third parties referenced or hyperlinked, in this communication.


