

Since our last report, gold appears to be undecided as to which direction it should take and today we are to take a look at the main fundamental issues, tantalizing its price action currently and in the coming week. For a rounder view we intend to conclude the report with a technical analysis of gold’s daily chart.
Gold’s negative correlation with the dollar is inactive
Over the past five days, the negative correlation of the USD with gold’s price appears to have been inactive. It’s characteristic how the USD Index has declined on Wednesday, Thursday and Friday, while gold’s price remained relatively unchanged or moved lower.
Observing the movement of the two mentioned trading instruments shows that the negative correlation is currently inactive. This trend could persist for the rest of the week. Moreover, we issue a warning for a possible decoupling of the two trading instruments.
Furthermore, U.S. bond yields continued to fall last week. Investor pessimism about the U.S. economic outlook seems to be growing.
Our concerns about the U.S. economy persisted after President Trump’s comments to FOX News. When asked about a possible recession, he responded, “there is a period of transition,” which may be concerning.
However, White House officials pushed back on recession concerns. Kevin Hassett, head of the National Economic Council, told Reuters there were many reasons for optimism about the U.S. economy despite some GDP contraction predictions.
Nonetheless, recession concerns in the U.S. could drive safe-haven inflows into gold, supporting its price.
US Financial releases ahead
Economists expect the inflation report to show easing pressures in the U.S. Core CPI is forecast at 3.2% year-on-year, down from 3.3%, while headline CPI may fall to 2.9% from 3.0%.
This scenario could pressure the Fed to cut rates sooner. This weakening the dollar and supporting gold prices due to their inverse relationship.
On the flip side, should the CPI rates showcase stubborn or even an acceleration of inflationary pressures in the US economy, it may have the opposite effect. However, we would like to note that the inverse relationship between the dollar and gold’s price, appears to be inactive.
Thus, we may focus on the inflation aspect, where easing inflationary pressures could lead to outflows from gold.
It is considered to be a hedge against inflation whereas an acceleration of inflationary pressures could aid the precious metal’s price.
Gold Technical Analysis
XAUUSD 4H Chart
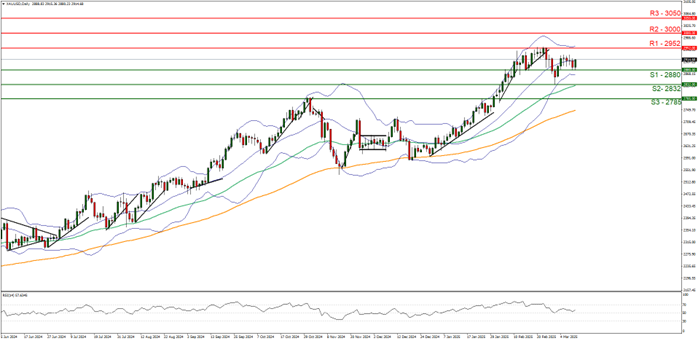
- Support: 2880 (S1), 2832 (S2), 2785 (S3)
- Resistance: 2952 (R1), 3000 (R2), 3050 (R3)
Gold’s price appears to be moving in a sideways fashion after bouncing off our 2880 (S1) support level. We opt for a sideways bias for the precious metal’s price, and supporting our case is the RSI indicator below our chart which has failed to break below the 50 figure and is currently below the reading of 60 which may imply a neutral market sentiment.
Although, with the current reading being relatively close to 60, it may still be said that some bullish tendencies may remain. Nonetheless, for our sideways bias to be maintained, we would require gold’s price to remain confined between the 2880 (S1) support level and the 2952 (R1) resistance line.
On the other hand, for a bullish outlook, a clear break above the 2952 (R1) resistance is needed. The next target for the bulls would be the 3000 (R2) resistance level.
Lastly, for a bearish outlook we would require a clear break below the 2880 (S1) support level with the next possible target for the bears being the 2832 (S2) support level.
Disclaimer:
This information is not considered investment advice or an investment recommendation, but instead a marketing communication. IronFX is not responsible for any data or information provided by third parties referenced or hyperlinked in this communication.


