
The downward motion of Oil prices has continued uninterrupted since our last report. Fundamentals related to the international oil market tend to be intense. In today’s report, we are to have a look at the data relating to the US oil market and continue to view the fundamentals stemming from Libya, OPEC and the demand side of the international oil market. To conclude the report we will also provide a technical analysis of WTI’s daily chart.
US oil market continues to tighten
The US oil market seems to be tightening with the data provided in the past few days. Last Friday we got the weekly Baker Hughes US oil rig count, which showed that the number of active oil rigs in the US remained unchanged at 483. The continued failure of the indicator’s reading to rise, showcasing that the number of active oil rigs in the US remained the same, may imply that the production levels continue to be sufficient for current demand levels in the US oil market, which may have been somewhat bearish for oil prices.
On Tuesday we got the API weekly crude oil inventories figure, which showed a substantial reduction of US oil inventories of 7.4 million barrels. The drawdown tended to imply that production levels have not been able to cover the aggregated demand in the US oil market implying further tightening in the past week. As such traders may be looking to the EIA weekly crude oil inventories figure to further confirm the anticipated tightening in the US oil market.
Nonetheless, the financial releases so far tended to imply that the US oil market remained tight as demand levels in the US oil market were able to surpass oil production. Overall, should we see data from the US oil market in the coming week, implying further tightening of the US oil market, we may see the data providing some support for oil prices.
An update on Libya’s oil blockade
On a fundamental level, we note that the crisis in Libya seems to be easing. In particular, Reuters reported that the 600,000-barrel oil tanker Front Jaguar was spotted loading at Libya’s Brega port on Wednesday. Thus, with tensions in Libya seemingly easing with a political solution to the issue appearing on the horizon, market worries about the supply side of the international oil market may ease and thus could weigh on oil prices.
Production and demand issues remain
In regards to oil production levels in the international oil market, discussions for OPEC’s intentions are ongoing. The oil production quotas set by the organization in order to drain excess oil in the market and the production levels are to be reviewed in a few weeks.
However, a recent report by Reuters claims that OPEC+ is discussing the possibility of delaying an oil output increase which was scheduled to start in October. Hence, should the group delay an increase in oil supply it could potentially provide support for oil prices. As for demand we highlight the release of the manufacturing PMI figures for August of China, which contracted one another, with the NBS figure implying a widening contraction in manufacturing activity in China, whereas the Caixin manufacturing PMI figure implied the opposite.
Nonetheless, the US appears to have taken the spotlight with both the S&P and ISM manufacturing PMI figures for August, showcasing a wider contraction in US manufacturing activity than what was expected by economists. Therefore, the implications of a contraction in manufacturing activity may also imply a reduction in demand which in turn may weigh on oil prices.
Технический анализ
WTICash Daily Chart
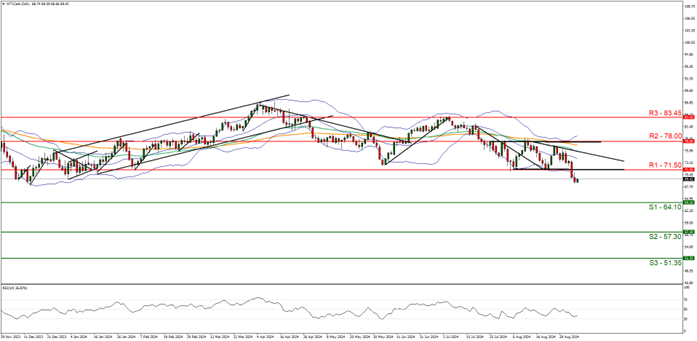
Support: 64.10 (S1), 57.30 (S2), 51.30 (S3)
Resistance: 71.50 (R1), 78.00 (R2), 83.45 (R3)
WTI’s price since our last report moved lower, with the commodity having broken below the support now turned to resistance at the 71.50 dollars per barrel figure. We opt for a bearish outlook for the commodity and supporting our case is the RSI indicator below our chart which currently registers a figure below 40 implying a strong bearish market sentiment, in addition to the downwards moving trendline which was incepted on the 13th of August.
For our bearish outlook to continue we would require a break below the 64.10 (S1) support line with the next possible target for the bears being the 57.30 (S2) support level. On the flip side for a bullish outlook, we would require a clear break above the 71.50 (R1) resistance line with the next possible target for the bulls being the 78.00 (R2) resistance level. Lastly, for a sideways bias we would require the commodity to remain confined between the 64.10 (S1) support line and the 71.50 (R1) resistance level.
Disclaimer:
This information is not considered investment advice or an investment recommendation, but instead a marketing communication. IronFX is not responsible for any data or information provided by third parties referenced or hyperlinked in this communication.


