
Oil prices moved higher since the last report, potentially due to the geopolitical tensions that still persist in the Middle East. In today’s report, we are to have a look at the data relating to the US oil market and continue to view the fundamentals surrounding the international oil market. To conclude the report we will also provide a technical analysis of WTI’s daily chart.
Middle East tensions
Tensions in the Middle East appear to have eased moderately, as Iran has yet to retaliate against Israel. The concern of a regional war came after the assassination of Hamas’s leader Haniyeh in Iran’s capital Tehran. Despite the posturing from Israel’s and Iran’s allies, no significant escalation has occurred since our last report and at the time of this report, Iran has not retaliated although that could quickly change.
However, what has been recently making its way around various media outlets, is the possibility of Hezbollah acting independently from Iran, in terms of launching a major attack. The aforementioned scenario has resulted in Israel warning that an attack which brings harm to Israeli civilians will be met with a disproportionate response.
Moreover, another possibility which has circulated in various media outlets, is the possibility of Israel launching a pre-emptive strike against Iran and Hezbollah.
Overall, despite the lack a significant escalation from the aforementioned parties it does not mean that the matter has ben put to rest and thus should we see an increase in hostilities, it could lead to concerns about the vital oil arteries in the region. In such a scenario, an increase in hostilities could aid oil prices.
On the flip side, should the situation de-escalate it could weigh on oil prices, as concerns in regards to the oil supply chain from the Middle East maydissipate.
US oil market remains tight
The data characterizing the current conditions of the US oil market seem to support the idea that the US oil market remains tight. On Friday, we note that the Baker Hughes oil rig count showed that active oil rigs remained steady at 482, in a sign that the demand side of the US oil market appears to have been maintained.
Furthermore, we note that on Tuesday, API reported that US oil inventories increased by 0.18 million barrels, which was lower than the expected increase in inventories by 0.85 million barrels, which tends to support the idea that the US oil market remains tight.
On Wednesday, we got EIA’s report about the US oil inventories, which also implied that the US oil market remained tight as it reported a drawdown of -3.728 million barrels, which was wider than last week’s reported drawdown of -3.436 million barrels, which further tends to support the theory of a tight US oil market.
Practically all three data related to the US oil market which were released since our last report, suggest that demand in the US oil market remains relatively tight.
Overall, the financial releases tend to have provided support for oil prices and should they continue to support the aforementioned theory in the coming week we may see oil prices moving higher.
US Department of Energy to continue refilling the SPR
The US Department of Energy announced a call for bids to supply up to 1.5 million barrels of oil, with another solicitation set to follow on the 12th of August for 2 million barrels.
The announcement by the DOE appears to be in order to continue replenishing the US Strategic Petroleum Reserve which saw massive withdrawals since 2021 in order to stabilize oil prices. As such, should the DOE continue on its current replenishment strategy, it may aid oil prices in the long run, as the US continues refilling its SPR.
However, we should note that the DOE’s stated goal is to buy crude oil at or below the $79 per barrel mark and thus should oil prices move higher, it may lead to that plan being placed on hold. Nonetheless, the signalling from the DOE that the replenishment of the SPR continues, could aid oil prices.
Технический анализ
WTICash Daily Chart
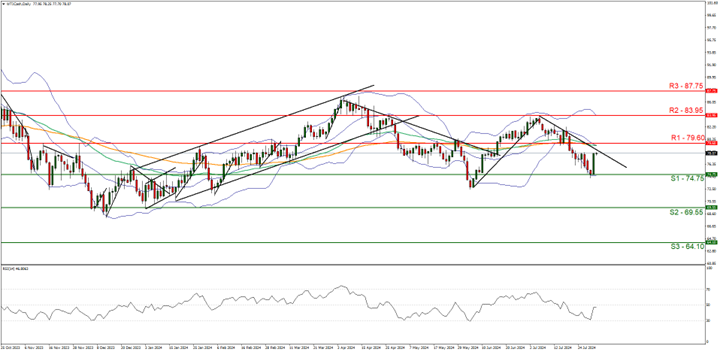
Support: 71.50 (S1), 64.10 (S2), 57.30 (S3)
Resistance: 78.00 (R1), 83.45 (R2), 89.50 (R3)
Oil ‘s price moved higher since the beginning of the week, potentially due to the fundamentals we mentioned above.
Nevertheless, from a technical analysis standpoint we continue to maintain our bearish outlook for the commodity and supporting our case is the downwards moving trendline which was incepted on the 18th of July and has remained intact, in addition to the RSI indicator below our chart which currently registers a figure near 40 implying a bearish market sentiment.
For our bearish outlook to continue, we would require a clear break below the 71.50 (S1) support level, with the next possible target for the bears being the 64.10 (S2) support line.
On the flip side, we would immediately switch our bearish outlook in favour of a bullish outlook in the event of a break above the 78.00 (R1) resistance level, with the next potential target for the bulls being the 83.45 (R2) resistance line. Lastly, for a sideways bias we would require the commodity to remain confined between the 71.50 (S1) support level and the 78.00 (R1) resistance line.
Disclaimer:
This information is not considered investment advice or an investment recommendation, but instead a marketing communication. IronFX is not responsible for any data or information provided by third parties referenced or hyperlinked in this communication.


