
With the beginning of the new year, there have been bearish signals from US stock markets with all three major indexes moving lower since our last equities report in 2023. Moreover, we note that since our last report, the NASDAQ 100 and Dow Jones 30, have dropped below their all-time high figures. In this report, we are to discuss Apple and Tesla, and finally conclude with a technical analysis of the Nasdaq 100.
Apple (#AAPL) drops with the market open
Apple (#AAPL) once the market opened on Tuesday, dropped by roughly 1.7%, which has been attributed to the company’s stock downgrade by Barclays to “underweight” from “equal weight”. The change in the company’s rating appears to have negatively impacted the company’s stock price, following the re-opening of the stock market after the Holiday season. Moreover, the company’s troubles seem to be far from over, as the patent infringement case by Massimo, appears to be continuing in 2024. As a small reminder, according to Massimo, Apple has violated its patents by allegedly stealing its pulse oximetry technology and incorporating it into the popular Apple watch. Following the ITC’s ruling, the U.S Court of Appeals for the Federal Circuit granted an emergency stay of the Apple watch ban, which gives Apple some breathing room, as the ruling blocks the U.S. government from enforcing the ITC’s decision, at least until the end of January according to some sources. The emergency stay of “execution” may have given Apple some breathing room, yet the damage may have already been done, as the Christmas holiday shopping period has passed, and thus Apple (#AAPL) may have missed out on significant revenue. In conclusion, should the ITC’s decision be upheld, Apple may lose significant revenue in the long run, which could weigh on the company’s stock price. However, should it manage to overturn the decision, the company’s stock price could find some support.
Tesla (#TSLA) gets overtaken in the Global EV race
Per Reuters, China’s BYD has overtaken Tesla (#TSLA), as the world’s biggest EV maker, despite Tesla’s fourth-quarter sales exceeding estimates. According to the report, Tesla sold 484,000 cars in Q4 of 2023, which exceeded the market expectations of 473,000. Yet, BYD reported EV sales of 526,000 for the same period, effectively overtaking Tesla. The dethroning of Tesla may have investors spooked that the company may be unable to keep up with rising competition in the EV market from China, and given BYD’s global ambitions, it could compete with Tesla on a global scale. As such, with the possibility of BYD potentially hurting Tesla’s sales in the long run, market participants may be worried about reduced sales from Tesla in the future, which could have weighed on the company’s stock price. Moreover, with the start of the new year, the number of EV models in the US, that qualify for EV tax credits, fell from 43 to 19, with Tesla’s Model 3 Rear Wheel Drive being excluded from the list of cars that qualify for EV tax credits. The tax credits may have been an incentive for first-time buyers to purchase EV vehicles, such as the Model 3, yet with the new regulations it may discourage potential first-time buyers from purchasing EV’s or even choose a model which get tax incentives instead of Tesla. Therefore, it appears that the possibility of reduced future sales may be impacting Tesla’s (#TSLA) stock price in a negative manner.
Технический анализ
US 100Cash Daily Chart
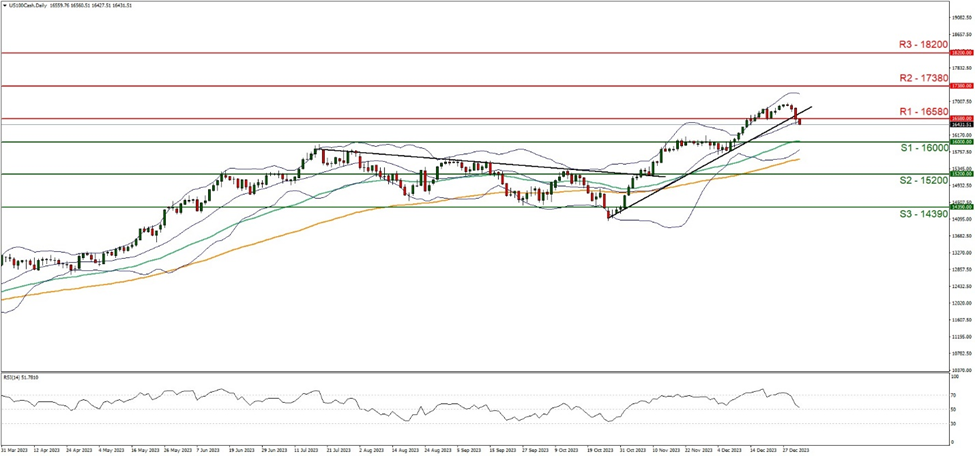
Support: 16000 (S1), 15200 (S2), 14390 (S3)
Resistance: 16580 (R1), 17380 (R2), 18200 (R3)
US 100’s price action has started the year in the reds, having broken below support turned resistance at the 16580 (R1) resistance level. We note that the upward movement of the index appears to have been interrupted by the price action breaking below the upward-moving trendline formed on the 26th of October 2023 that was guiding the index. Yet, we note that the Bollinger bands appear to be tilted to the upside for now, and may imply some bullish momentum remains in the market. Nonetheless, we would feel more comfortable to adopt a clear cut bearish outlook if the price action continues to fall to lower ground, in addition to the RSI indicator, diving below the reading of 50 signaling the build-up of a bearish sentiment in the market. For our bearish outlook to continue, we would like to see a clear break below the 16000 (S1) support level, with the next possible target for the bears being the 15200 (S2) support base. On the other hand, for a neutral outlook, we would like to see the index remain confined between the 16000 (S1) support level and the 16580 (R1) resistance line. Lastly for a bullish outlook, we would require a clear break above the 16580 (R1) resistance level, with the next possible target for the bulls being the 17380 (R2) resistance ceiling.
If you have any general queries or comments relating to this article please send an email directly to our Research team at research_team@ironfx.com
Disclaimer:
This information is not considered as investment advice or an investment recommendation, but instead a marketing communication. IronFX is not responsible for any data or information provided by third parties referenced, or hyperlinked, in this communication.


