
There was an easing in market worries about the Israeli conflict as a temporary ceasefire seems to have been agreed upon, yet the market seems to have priced in largely that issue and other matters tend to move the oil market at the present. In this report, we aim to shed light on the factors driving WTI’s price over the past week, assess its future outlook, and conclude with a technical analysis of WTI.
Oil: Overview Report
A slack in the US oil market?
We make a start with the Baker Hughes oil rig count, which indicated that the number of active oil rigs in the US rose and seems to have stabilised last week at 500. The rise tends to imply that the demand side of the US oil market may have strengthened. Yet, API on Tuesday showed a substantial increase of US oil inventories, of about 9 million barrels.
The increase of US oil inventories was verified by EIA which reported an increase of US oil inventories at the region of around 8.7 million barrels. Overall, both indicators align that aggregated demand in the US was not able to reach production levels which in turn leads towards a slack in the US oil market. Should demand not be able to absorb oil production in the US in the coming week as well, we may see the overall situation weighing on oil prices.
OPEC’s meeting
Yet the market’s attention is currently on the production side of the international oil market and specifically on OPEC+. It was characteristic how oil prices fell on Wednesday after an announcement of a postponement of OPEC’s meeting for November 30th, that was originally planned for this weekend. It should be noted that analysts tended to highlight the possibility of OPEC+ maintaining its low production levels for another month, or even cutting production levels even lower.
Arguments for such a scenario included the lowering price of oil and the market worries for a weak demand side from China, with the latter not being adopted by OPEC though. Yet the postponement was interpreted as a sign of hesitancy on behalf of the oil-producing cartel towards such a direction and tended to drive oil prices, lower. We still see the need though on behalf of Saudi Arabia to raise the price of oil and thus we would suspect that the Saudis are to continue pushing for lower production levels and may be just able to achieve some deeper cuts.
Should that scenario be adopted by the market, we may see some bullish tendencies building up for oil prices as the meeting date nears, yet should the market expect an easing of production cuts, we may see the bears ruling over oil prices.
Weak Chinese demand?
Despite the optimistic reports for the demand side of the oil market issued by both OPEC and EIA, we still maintain our doubts. In the epicenter of attention remains China and for a sustainable rise of oil demand, we still would require an increase of economic activity in the country’s manufacturing sector. Yet Reuters highlights in a recent report that oil market experts tend to anticipate oil demand growth to ease in the first half of 2024.
They expect that a possible rise of oil consumption by aviation and the petrochemical industry in China could be offset by a reduction of demand in the country’s construction sector. On the other hand, we have to note that China is preparing packages to aid its property developers, as fears continue to mount about the resilience of the Chinese economy.
Such a move could potentially aid in economic development in China, which in turn may provide some support for oil prices. Furthermore, we expect the PMI figures for November, in the US and China, which could have a supportive role in the direction of oil prices, should an increase of economic activity be reported for the current month.
Oil: Technical Analysis
WTI Cash H4 Chart
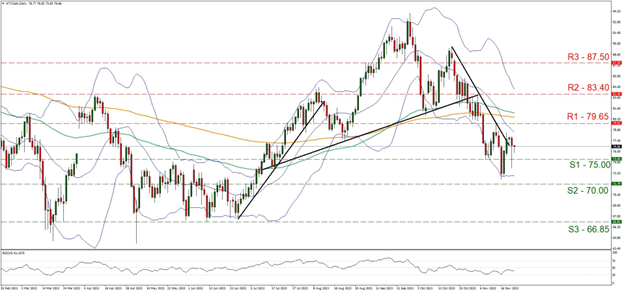
- Support: 75.00 (S1), 70.00 (S2), 66.85 (S3)
- Resistance: 79.65 (R1), 83.00 (R2), 85.55 (R3)
WTI’s price currently shows some signs of stabilisation between the 75.00 (S1) support line and the 79.65 (R1) resistance line. It’s characteristic how the commodity’s price action has broken, at least for the time being, the downward trendline that has been guiding it since the 20th of October, in a first signal that the downward movement has been interrupted. The fact that the downward pressure has been broken tends to lead us to a switch of the bearish outlook in favour of a bias for a sideways motion initially, as the price action seems about to stabilise.
Yet we note that the RSI indicator below our daily oil chart is still below the reading of 50, implying a residue of bearishness in the market sentiment and some sort of correction higher could be expected by the commodity’s price after the RSI indicator hit the reading of 30. For the bearish outlook to be maintained though, we would require the price action of WTI to break clearly the 75.00 (S1) support line, but also the 70.00 (S2) support level, forming a new lower low and thus shifting the downward trendline to the right. As the next possible target for the bears, we set the 66.85 (S3) support barrier, which was aimed for in late May and throughout June. On the flip side should the bulls find a chance and take over the direction of WTI, we may see it breaking the 79.65 (R1) resistance line and aim for the 83.40 (R2) resistance nest. Higher than that we note the 87.50 (R3) resistance hurdle.
Isenção de responsabilidade:
Esta informação não deverá ser considerada como aconselhamento ou recomendação ao investimento, mas apenas como comunicação de marketing.


