
WTI is currently down for the second consecutive week, possibly surprising investors with new developments. With the Oil market providing an excess of information for traders to work with, this report will present the key events currently affecting the commodity’s prices. We aim to be accurate and to the point with information, blending in the report a number of opinions at the same time. As always, we will end our report with a technical analysis that will display the most probable price levels that stand out from our point of view.
We make a start with the weekly US Oil market data releases from the past days. On Wednesday the American Petroleum Institute inventory levels displayed a large surplus of 5.6M barrels. The surplus is usually considered a negative sign for prices, ultimately pushing them lower. We must note the API had displayed surpluses for the past three consecutive weeks, which may have invited some bearish interest for WTI prices. On a similar note, the EIA has also displayed two consecutive surpluses in the past weeks, doubling down on the support for lower Oil prices. Traders should be on the lookout for the next Energy Information Administration’s (EIA) Crude Oil Inventories, as they can create volatility for WTI.
In the past days, media sources indicated the US is considering a fuel tax holiday plan, aimed at easing the record high Oil prices. Even though such a move would have to be voted upon lawmakers in Congress before being passed, it could potentially make fuel cheaper for consumers as the tax would be removed from the total cost of the fuel. Some analysts suggest that such a move could potentially uplift Oil demand and perhaps increase Oil prices instead of lowering them. In any case, fuel taxes have been in place for decades and could prove a great challenge to be reversed.
Moving to the crucial Oil producing group, OPEC, which remains a determining factor in terms of demand and supply for the international Oil scene. Contemplating information derived from the group’s June report, we could find clues as to where the Oil market is heading, in terms of price action but also challenges. First of all, regarding the market’s prospects for the second half of 2022, the group forecasted Oil demand will remain solid. Accordingly, OPEC also noted it will advance the planned production adjustments of September 2022 to ensure market stability. After this note, we may be seeing an increase of production looking forward, as the Oil market’s fundamentals may tolerate such a move. Yet on a more concerned note, OPEC also highlighted its worries over geopolitical developments which are unknown when they will be resolved and the pandemic which continues to pose a considerable risk for the recovery to pre-pandemic levels. In addition, some OPEC players like Libya, Nigeria, Iraq, Gabon and Iran saw their Oil outputs decline in May. It would be very interesting to see the production levels for June, as they could determine price stability or volatility accordingly.
As a final note, we would like to refer to the EIA June short term energy outlook which highlighted the uncertainty over Russia’s oil production as a response to the sanctions, OPEC’s production levels and the rate at which the U.S. Oil and natural gas producers may increase drilling. These subjects remain in our opinion in the Oil market’s focus thus may require special attention from traders as updates could move crude oil prices.
Análise técnica
WTI H4
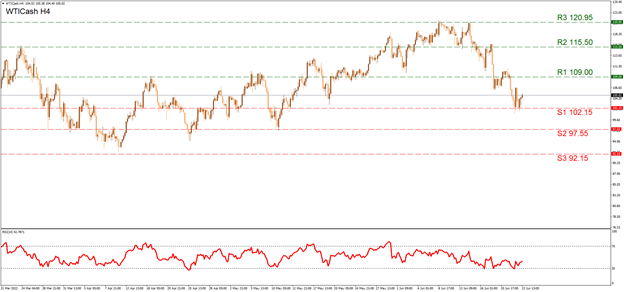
The recent downward trend has been ongoing since the 14a. of June and it had reached its lowest yesterday the 22a. of June, when it tested the (S1) 102.15 support. The (S1) was clearly tested various times but displayed strength holding its ground. If the selling is to persist, we could see the (S2) 97.55 line being engaged once again, after it was attempted back in early May. If the selling momentum is exaggerated, we also note the (S3) 92.15 hurdle that could become a target. On the other hand, in a buying scenario we may see WTI regaining some ground and testing the (R1) 109.00 resistance which was encircled but abandoned in the past days. If the buying orders are in excess, we may see a retesting of the (R2) 115.50 barrier, while the highest level for the past three months remains the (R3) 120.95 hurdle, making it a strong barometer for a bullish trend. In the short term WTI has been mostly in a selling trend that has led the RSI indicator testing the 30 level for the 3rd time in June. In a more medium term view the instrument is still moving above $100 per barrel which could imply some sideways motion.
Se tiver alguma dúvida ou comentários sobre este artigo, solicitamos que envie um email diretamente para a nossa equipa de Research através do research_team@ironfx.com
Isenção de responsabilidade:
Esta informação não é considerada como aconselhamento ou recomendação ao investimento, mas apenas como comunicação de marketing. O IronFX não é responsável por quaisquer dados ou pela informação fornecida por terceiros aqui mencionados, ou com links diretos, nesta comunicação.


