
Gold’s price moved in a sideways fashion since the last report, yet seems to be hitting a ceiling at $2355 per ounce. Today we are to discuss the fundamental challenges laid ahead for the precious metal as well as upcoming financial releases that may affect the direction of its price action. Finally, we will be concluding this report with a technical analysis of gold’s daily chart.
Gold’s negative correlation with the USD
Gold’s price tended to maintain its negative correlation with the USD over the past few days, with the greenback being in the lead. It’s characteristic that especially since yesterday, the weakening USD seems to be benefitting gold’s price. Yet we have to note that in the past week, the relative inactivity of the greenback tended to muddy the waters somewhat for the markets.
We expect in the coming week, the negative correlation of gold with the USD to be maintained and become more clear possibly supported also by increased volatility. Hence, should the USD be on the rise we may see gold’s price slipping and vice versa.
Financial data ahead
The release of the US ISM manufacturing PMI figure for May tended to highlight the importance of US financial data releases for the price of gold, given also the negative correlation of the precious metal’s price with the USD as analysed before.
It was characteristic that the indicator’s reading unexpectedly dropped, implying a wider contraction of economic activity for the US manufacturing sector, which in turn tended to darken the US economic outlook.
Understandably the release weighed on the USD, while at the same time allowed gold’s price to gain some ground. Given the market reaction for the release of May’s ISM manufacturing PMI figure, we expect the market to maintain interest also for the sister indicator of the ISM non-manufacturing PMI figure for the same month on Wednesday.
Yet the market interest is expected to turn towards the release of various US employment data this week, with the list including April’s JOLTS Job Openings today, on Wednesday ADP National employment figure for May, on Thursday the weekly initial jobless claims figure and the crown being on Friday the release of May’s US employment report with its NFP figure.
Should the data and especially May’s US employment report reflect a tight US employment market, we may see the USD getting some support and consequently weighing on gold’s price and vice versa. We have to bear in mind that a tight US employment market could allow the Fed to maintain rates high for longer, thus allowing the release to generate substantial interest beyond the FX market per se.
Central banks buying gold
We note the reports stating that central banks seem to be picking up in buying gold over the past few months. Geopolitical and macroeconomic uncertainty tend to be on the rise and provide a boost to buying gold by central banks.
It should also be noted that US bonds could play the role of an alternative acquisition for central banks given also the relatively better returns on the investment. Yet for the time being we see gold being the preferred safe-haven instrument of choice.
Hence should the buying spree of central banks for gold be maintained over the coming months or even intensify, we may see the increased demand pushing gold’s price higher, may be even to new record highs.
On the flip side should the yields of US bonds rise we may see central banks diverting some of their investments in that area thus weakening the demand for gold and weighing on the precious metal’s price.
Análise técnica
XAUUSD Daily Chart
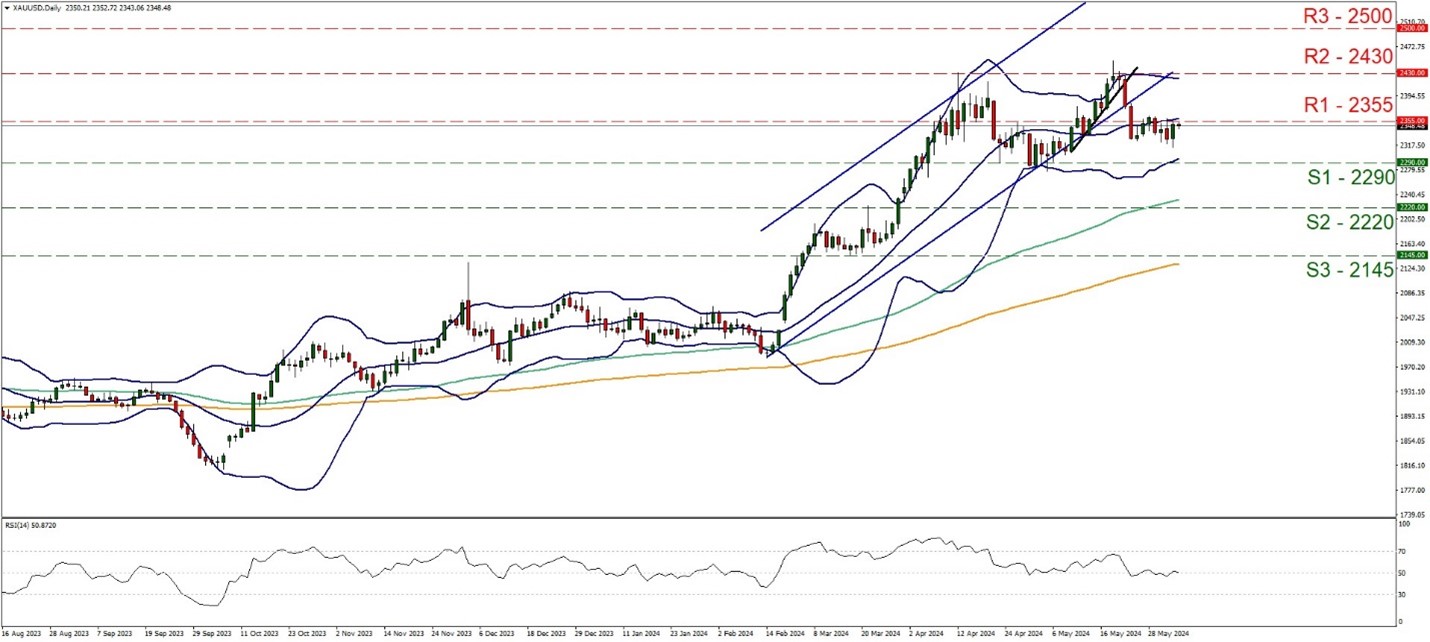
- Support: 2290 (S1), 2220 (S2), 2145 (S3)
- Resistance: 2355 (R1), 2430 (R2), 2500 (R3)
On a technical level, gold’s price appears to have remained in a sideways motion just below the 2355 (R1) resistance line over the past week.
The sideways motion was underscored also by an RSI indicator running along the reading of 50, implying a rather indecisive market that may allow the sideways movement to continue. Hence for the time being we tend to maintain a bias for the rangebound motion to be maintained.
Yet we have to note that the 100 moving average (MA, green line) and the 200 MA (orange line) are still pointing upwards implying the presence of a residue of bullishness among market participants. But for a bullish outlook we would require the precious metal’s price to breach clearly the 2355 (R1) resistance line, which has formed currently a ceiling for gold’s price and take aim of the 2430 (R2) resistance level, which in turn is an all-time high point for the shiny metal’s price.
Should also the R2 be broken we set as the next possible target for the bulls the 2500 (R3) resistance hurdle. On the flip side should the bears take over, we may see gold’s price relenting yesterday’s gains and breaking the 2290 (S1) support line, which held its ground against the downward pressure in the first days of May.
Should the S1 be broken we note the former resistance line now turned to support 2220 (S2), while even lower we find the 2145 (S3) support base, which formed a platform for the precious metal’s price rise on the 19th and 20a. of March.
Isenção de responsabilidade:
Esta informação não deverá ser considerada como aconselhamento ou recomendação ao investimento, mas apenas como comunicação de marketing.


