
Gold’s price renewed its bearish tendencies on Friday despite some hesitation in the days before. The downward motion had a strong fundamental background and we tend to note that there is still volatility ahead for the precious metal in the current week. Today we are to discuss the fundamentals that underpinned the rally while also have a look at the challenges laid ahead for the precious metal, while we will be concluding this report with a technical analysis of gold’s daily chart.
Gold Market Report
The US employment report
The USD got some support on Friday as the US employment data for November were better than expected. Characteristically the Non-Farm Payrolls (NFP) figure came in at 199k instead of the expected figure of 180k and the unemployment rate dropped to 3.7% despite being expected to remain unchanged at 3.9%. Despite the possibility of a seasonal effect, on a general level, the data tended to highlight once again the resilience and tightness of the US employment market.
The release may harden the Fed’s hawkish stance and contradict the market’s expectations for an early rate cut. It’s characteristic that Fed Fund Futures, before the releases implied the possibility of 5 rate cuts in the next year and after the release, implied only 4 rate cuts. In conclusion, should the Fed adopt a more hawkish stance, we may see the greenback strengthening, which may exert further downward pressures on gold, due to their inverse relationship.
November’s US CPI data
We anticipate that the high levels of volatility in the gold market to remain elevated for the rest of the week. In particular, the release of the US CPI rates for November later on today, could further highlight the negative correlation of gold’s price with the dollar, which appears to have re-emerged somewhat in the past few days. Yet some degree of asymmetry is also expected to be present.
Nonetheless, the headline rates are expected to show some signs of easing inflationary pressures, on the contrary, the Core CPI rates, are expected to hint at persistent inflationary pressures. In the event, that the CPI rates show persistent inflationary pressures in the US economy, they may also add pressure on the Fed to remain relatively hawkish which in turn could support the dollar and as a result, could create bearish tendencies for gold’s price. Whereas, easing inflationary pressures in the US economy may weaken the USD and support gold’s price.
The Fed’s interest rate decision
Yet we should not miss the forest for the tree. The highlight for the week for gold traders is expected to be the release of the Fed’s interest rate decision on Wednesday. The market is expecting the Fed to remain on hold at 5.00-5.25% with FFF currently implying a 99% for such a scenario to materialize. As such the attention may shift to the Fed’s accompanying statement, which may highlight the bank’s future intentions and Fed Chairman Powell’s post-decision press conference being the epicenter of attention.
As was mentioned above, the US employment market tightened in November, and should it be combined with indications of persistent inflationary pressures in the US economy, it may increase the pressure on the Fed to maintain a hawkish stance in regards to its monetary policy. On the flip side should inflationary pressures ease further, it may allow for the pressure on the Fed to ease somewhat, potentially outweighing the relatively tight US employment market. For the time being, we see risks, being tilted towards the hawkish side, yet the wording in the bank’s accompanying statement may play a crucial role in dictating the market’s opinion.
On a second note, we also highlight the release of the new dot plot that is to show the intentions of Fed policymakers and should the dot plot indicate that the majority of policymakers do not expect the bank to proceed with wide rate cuts as expected by the market, or that the start of rate cuts is to come at a later stage in 2024, we may see once again the greenback strengthening and gold’s price declining.
Gold – Technical Analysis
XAUUSD 4-Hour Chart
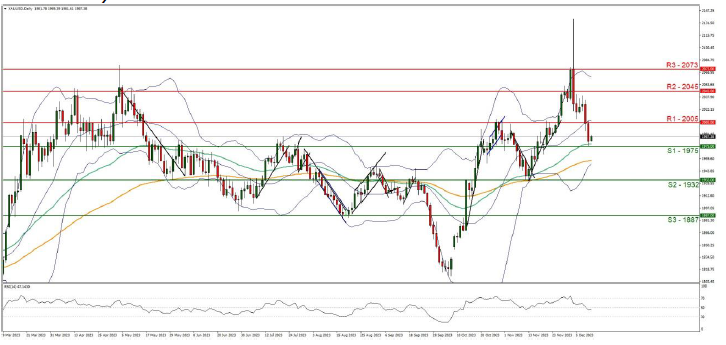
- Support: 1975 (S1), 1932 (S2), 1887 (S3)
- Resistance: 2005 (R1), 2045 (R2), 2073(R3)
On a technical level, we note that Gold appears to have moved lower since last week, and should it continue on its current trajectory till the end of the week, it could mark two weeks in the reds for the precious metal. It should be noted that the RSI indicator landed on the reading of 50, implying a rather indecisive market.
Overall, the data tends to imply a possible sideways motion, yet the intense downward motion in addition to breaking below the key psychological figure of 2000, may imply a bearish market sentiment, and as such we maintain a bearish outlook for gold. For the bearish outlook to be maintained we require the price action to break the 1975 (S1) support line and aim for the 1932 (S2) support nest.
Even lower we note the 1887 (S3) support barrier. On the flip side, for a sideways bias, we would like to see the precious metal remain confined between the 1975 (S1) support level and the 2005 (R1) resistance line. Lastly, should the bulls take over once again we may see gold’s price reversing course, breaking the 2005 (R1) resistance line and aim for the 2045 (R2) resistance hurdle. Even higher we note the 2073 (R3) resistance nest.
Isenção de responsabilidade:
Esta informação não deverá ser considerada como aconselhamento ou recomendação ao investimento, mas apenas como comunicação de marketing.


