
Gold at the time of this report, seems to be moving in an upwards fashion, gold report since last week. We note the high volatility in the gold market, as tensions in the Middle East appear to be rising, with the risk of a regional conflict, may keep volatility elevated until the current conflict is resolved.
In this report, we aim to shed light on the catalysts driving gold’s price, assess its future outlook and conclude with a technical analysis.
Tensions in the Middle East
Over the weekend, tensions appear to have escalated in the Middle East, causing great concern over the stability of the region. The increasing Geopolitical tensions carry the risk of spilling into a regional confrontation, which may destabilize the Middle East and given the region’s significance to the global markets, it may have a significant impact on global economies which are not directly involved. Furthermore, it would appear that the heightened risks of a regional conflict appear to be making their way into the commodities markets, in particular gold. Therefore, given the precious metals safe haven status, it appears that the particular relationship is once again being evident, as gold appears to have received safe haven inflows, which may have aided to the precious metal’s ascent during today’s trading session.
However, we would like to highlight that the US September Non-Farm Payrolls figure, vastly exceeded market expectations last Friday. As such, with a perceived tight labor market, the Fed may have to hike in their next monetary policy meeting, which is due to take place at the beginning of November. The possibility of a hike by the Fed, could support the greenback and due to their inverse relationship with the precious, it could weigh on the price of gold.
Central Banks continue their gold hoarding spree
According to the World Gold Council, Central Banks have collectively increased their gold reserves for the third row in a month, adding 77 trillion to global official reserves during the month of August, which is a 38% up-tick from July. The continued addition of gold reserves, on a macro-economic level, may provide some support the precious metal over the long run, thus potentially mitigating impacts from factors which may negatively affect the price of gold. Moreover, the gradual but steady increase in gold reserves by central banks, may be indicative of a continued concern by central banks that an economic downturn may be nearing and as such by diversifying into the precious metal, they may be hedging against times of financial uncertainty.
Therefore, on a macro-economic level, we may see the precious metal gaining support in the long run. However, currently high interest rate levels, could potentially overshadow the gold hoarding by central banks, as policymakers have indicated that they may stay at their current levels for a prolonged period of time. As such, we may see demand for the precious weakening, as other interest-bearing assets such as Government bonds, may be more appealing to investors, thus potentially weighing on the precious metal.
Gold – Technical Analysis
XAUUSD 4-Hour Chart
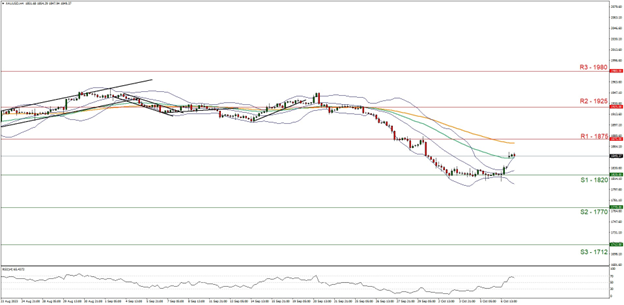
- Support: 1820 (S1), 1770 (S2), 1712 (S3)
- Resistance: 1875 (R1), 1925 (R2), 1980 (R3)
The precious metal appears to be moving in an upwards fashion after opening higher during today’s trading session. We maintain a bullish outlook and supporting our case is the RSI indicator below our 4-Hour Chart which currently registers a figure near 70, implying a strong bullish market sentiment. Yet, we must note the gap formed when the gold market opened today compared to Friday’s closing figure and as such, we may see the precious aiming to close or retrace back to that gap before moving higher.
For our bullish outlook to continue, we would like to see a clear break above the 1875 (R1) resistance level, with the next possible target for the bulls being the 1925 (R2) resistance ceiling. On the other hand, for a bearish outlook, we would like to see a clear break below the 1820 (S1) support level, with the next possible target for the bears being the 1770 (S2) support base.
Lastly, for a neutral outlook, we would like to see the commodity remaining confined between the 1820 (S1) and the 1875 (R1) support and resistance levels respectively. Moreover, the widening of the Bollinger bands imply high market volatility and as such we may see volatile price swings in either direction.
Isenção de responsabilidade:
Esta informação não deverá ser considerada como aconselhamento ou recomendação ao investimento, mas apenas como comunicação de marketing.


