

Gold prices renewed their bullish tendencies last week, influenced by the Federal Reserve’s interest rate decision, as compared to the previous report. The upwards motion had a strong monetary policy background and we tend to note that there is still volatility ahead for the precious metal in the current week. Today we are to discuss the fundamentals that underpinned the rally while also have a look at the challenges laid ahead for the precious metal, while we will be concluding this report with a technical analysis of gold’s daily chart.
Gold Market Report
November’s US Core PCE data
We anticipate that the high levels of volatility in the gold market to remain elevated for the rest of the week. In particular, the release of the US Core PCE rates for November later on this week could once again further highlight the negative correlation of gold’s price with the US Dollar. We should note that the CPI rates for November which were released last week, seem to have been widely ignored by the market.
Nevertheless, the rates are expected to show some signs of easing inflationary pressures. In the event, that the Core PCE rates, which are the Fed’s favorite tool for measuring inflation, show persistent inflationary pressures in the US economy, they could ease market expectations of 6 rate cuts by the bank next year, which in turn could support the dollar and as a result, could create bearish tendencies for gold’s price. Whereas, easing inflationary pressures in the US economy may weaken the USD and given the two instruments’ negative correlation, support gold’s price.
Post Fed decision impact and the week ahead
The Fed’s interest rate decision last Wednesday, appears to have had a positive impact on gold’s price. The bank remained on hold, as was widely expected, and appeared to validate market expectations that the Fed is preparing to cut interest rates next year. Moreover, Fed Chair Powell seemed to embrace the market’s expectations of rate cuts by the Fed next year, having stated that “the next question, which is when it will become appropriate to begin dialing back the amount of policy restraint that’s in place”. As such, the dovish undertone, appeared to fall in line with the anticipation that the Fed has reached its terminal rate and is preparing to cut, which may have weakened the dollar. As such, given gold’s inverse relationship with the dollar, the precious metal appeared to have capitalized on the dollar’s weakness and following the release, moved higher.
On the other hand, Cleveland Fed President Mester and Chicago Fed President Goolsbee, appeared to hit back the market expectations of 6 rate cuts. The Fed policymakers’ statements, seem to be supported also by the new dot plot, implying 3 potential rate cuts next year. In particular, Fed President Goolsbee who is a known “dove”, stated on Sunday “We’ve made a lot of progress in 2023, but I still caution everyone, it’s not done”, which might been seen as hawkish, as he could be implying that the bank may need to keep interest rates at their current levels for a prolonged period of time.
Therefore, despite attempts by Fed officials to reign in the market, it appears to have had no significant impact, with the precious metal potentially capitalizing on the weaker dollar last week. In conclusion, with numerous Fed officials, due to speak this week, we anticipate that in order for a significant market reaction, they may have to significantly amp up their hawkish rhetoric, or it may be ignored by the market participants once again. In such an event gold may weaken as the dollar could strengthen, whereas should Fed officials fail to excite the markets, we may see gold gaining or maintaining its current levels.
Gold – Technical Analysis
XAUUSD Daily Chart
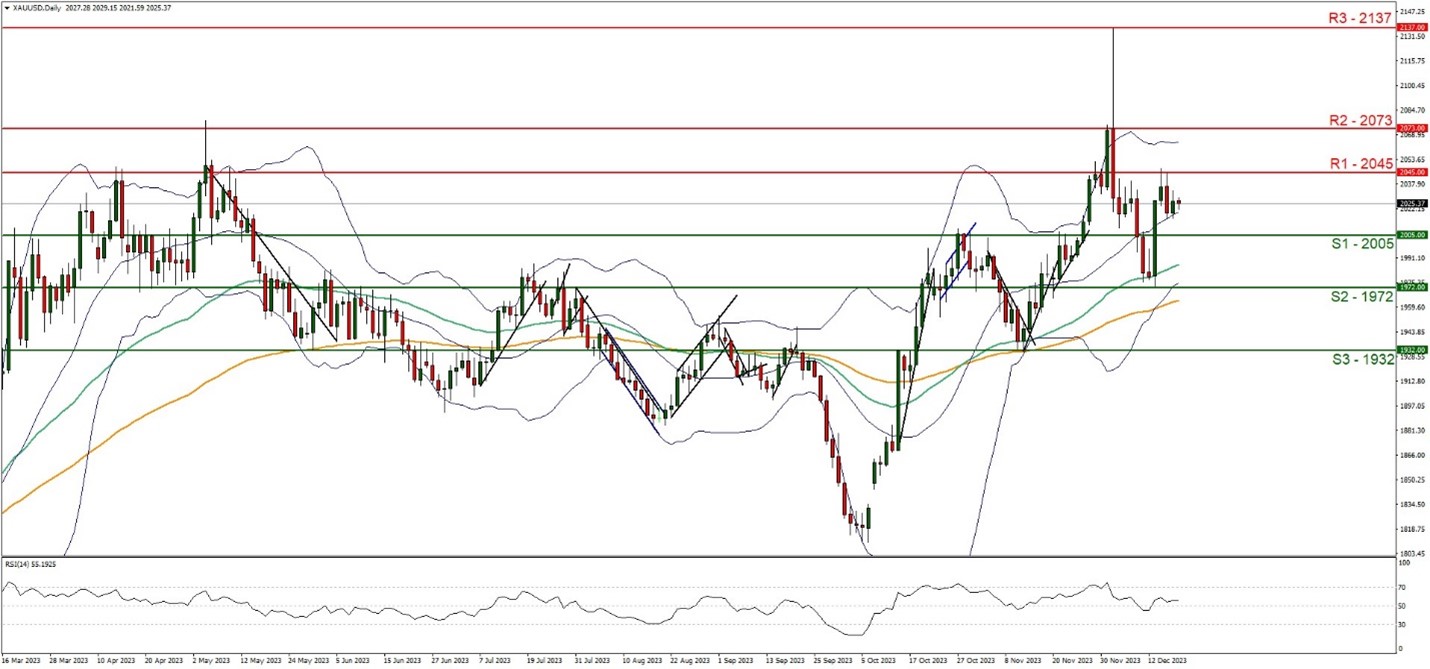
- Support: 2005 (S1), 1972 (S2), 1932 (S3)
- Resistance: 2045 (R1), 2073 (R2), 2137 (R3)
On a technical level, we note that Gold appears to have moved higher since last week, with the precious metal having broken above the resistance line, now turned to support, at the 2005 (S1) level, and having tested resistance at the 2045 (R1) level before stabilising somewhat. It should be noted that the RSI indicator below our daily chart currently remains near the figure of 50, implying a rather indecisive market.
Overall, the data tends to imply a possible sideways motion, yet the intense upward movement on the 13th of the month, in addition to breaking above the resistance line now turned to support at the 2005 (S1) level, may imply a bullish market sentiment, in addition to the Bollinger band median, which appears to be tilted to the upside, implying a bullish market sentiment as also do the 50 and 100 moving averages.
Nonetheless, we maintain a sideways bias for gold’s price action, given the recent stabilization of the precious metal’s price. For our sideways bias to continue, we would like to see the precious metal remaining confined between the 2005 (S1) support level and the 2045 (R1) resistance line. Whereas, for a bullish outlook, we would like to see a clear break above the 2045 (R1) resistance level, if not also a break above the 2073 (R2) resistance line, with the next possible target for the bulls being the all-time high figure of 2137 (R3). Lastly, for a bearish outlook, we would like to see a clear break below the 2005 (S1) support base, with the next potential target for the bears being the 1972 (S2) support line.
Isenção de responsabilidade:
Esta informação não deverá ser considerada como aconselhamento ou recomendação ao investimento, mas apenas como comunicação de marketing.


