
Since last report ,Oil prices seem to have stabilised since last week’s report and there seems ot be no alternative in sight at the current stage. Today we are to take a look at the data of the US oil market, OPEC’s intentions and the demand side of the international oil market. For a rounder view, we are to conclude the report with a technical analysis of WTI’s daily chart.
Slack in the US oil market maintained
We make a start with the data on the ground of the US oil market by noting that the Baker Hughes US oil rig count showed that the number of active US rigs contracted by one, reaching 478. On Tuesday API reported a substantial increase of US oil inventories of 4.753 million barrels a figure eclipsing the slight drawdown reported by the prior release of -0.777 million barrels and implying a slack on the US oil market.
It should also be noted that yesterday EIA reported a narrowed increase of US oil reserves of 0.545 million barrels. Nevertheless we still see that production levels were able to surpass aggregated oil demand in the US thus we do not see any tightness arising. We expect that should there be any further indications of further easing of the US oil market it could weigh somewhat on the prices in the coming week.
OPEC seems set to maintain production cuts
On the supply side of the international oil market we note OPEC’s intentions as a key driver for prices. We are skipping the comment of the Head of the oil production alliance that is a “gift of God”, and have a look at what the organisation sems willing to supply the market.
Recent articles highlighted that OPEC+ has little room to manoeuvre regarding its production levels as weak demand tends to weigh on oil prices. Please note that the production organisation had initially planned to start rolling back oil production cuts, over the months of the coming and next year.
For the time being we see the case for OPEC+ to delay any increase in production beyond 2024, possibly also beyond the first quarter of 2025. Further signals from OPEC+ pointing towards a delay in the increase of oil production are expected to provide bullish signals for oil prices. On the flip side though we do not expect OPEC+ to proceed with even deeper production cuts either, which could be a relief for oil traders.
Demand side of oil
Regarding oil demand levels we tend to highlight the two main consumers in the world, namely the US and China. In the US oil demand seems to be weak, while the manufacturing sector may have a decrease of economic activity. On the other hand, China’s manufacturing PMI tend to suggest that its factories are struggling for economic activity showing only marginal increase for the past month.
On a more direct indication for the oil market China’s analysts estimate that crude imports may reach around 11.4 million barrels per day (bpd) in the current month, showing a new peak since August, according to analysts, which we view as a positive. Overall, should we see signs of increased activity in manufacturing sectors of both the US and China, it could have a positive impact on oil prices and vice versa.
Oil Technical Analysis
WTICash Daily Chart
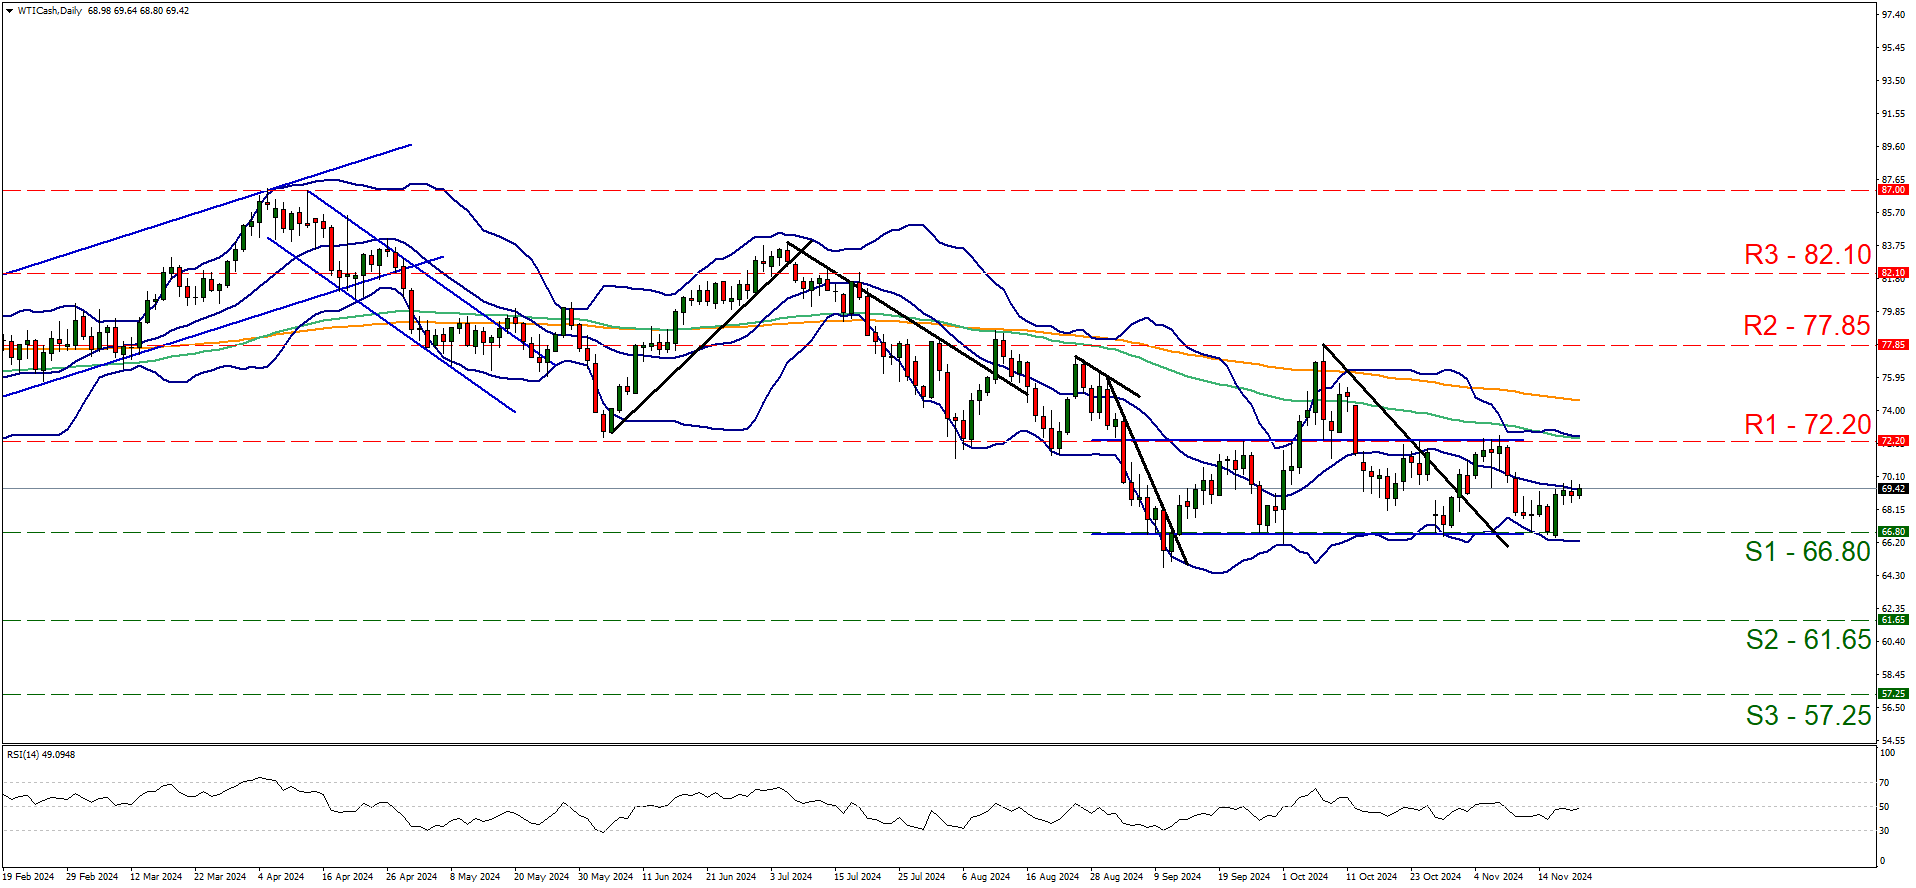
- Support: 66.80 (S1), 61.65 (S2), 57.25 (S3)
- Resistance: 72.20 (R1), 77.85 (R2), 82.10 (R3)
Oil’s price edged lower last Friday yet bounced on the 66.80 (S1) support line and stabilised in the midst between the S1 and the 72.20 (R1) resistance line. We tend to maintain our bias for the sideways motion to continue between the prementioned levels, given also that he RSI indicator runs along the reading of 50, implying a rather indecisive market that may allow the sideways motion to continue.
For a bullish outlook to emerge we would require the commodity’s price action to break the 72.20 (R1) resistance line clearly and start aiming for the 77.85 (R2) resistance hurdle. For a bearish outlook, we would require WTI’s price to drop below the 66.80 (S1) support line with the next possible target for the bears being set at the 61.65 (S2) support barrier.
Disclaimer:
This information is not considered investment advice or an investment recommendation, but instead a marketing communication. IronFX is not responsible for any data or information provided by third parties referenced or hyperlinked in this communication.
