
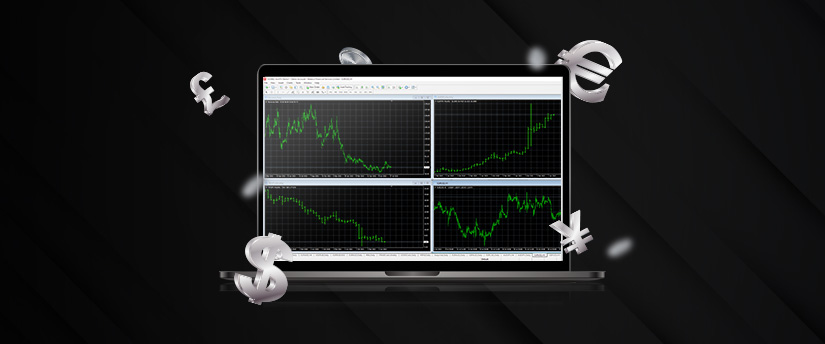
When you open a Forex trading account and start trading, you need to learn how to use a few charting tools to assist you in making informed trading decisions. Apart from reading market news and conducting fundamental analysis, you will also need to perform technical analysis. Forex charting tools are essential for technical analysis, using expert advisors and testing. This is why learning how to read charts such as a line chart, a bar chart or a candlestick chart will help you become a more efficient and confident trader.
In this article, we will look at chartsing tools, how to read them, the different types of charts and much more.
How to read Forex charts
To begin, you need to open a chart in your MT4 trading platform. You can then choose a charting tool type: a line chart, a bar chart or a candlestick chart. Since a price chart displays the price changes of a security and the time, you need to be able to understand the price points as well as the timeframe of the chart, whether it’s a 1-minute chart or up to a 1-month chart.

How to open a chart in MT4
To open a chart, log in to MT4. Select a specific currency pair from the Market Watch window, right-click on it, and subsequently choose the option to open the chart window.
Alternatively, at the top right of the MetaTrader 4 window, you can click the mt4_new_chart_button button in the standard toolbar and then select a currency pair.
After opening a new chart you will be able to see the price action of your selected currency pair. You can customise your chart and create your preferred template.
The basic components of a chart
With a forex charting tool, you can see the price changes of a currency pair. A chart will show two axes: the vertical or y-axis which wil display the price, and the horizontal or x-axis which will show a specific time period.
The progression of price action occurs from the left side to the right side of the chart, resulting in the most recent price data being displayed on the right side. The markings on the x-axis indicate a particular time period, which can vary depending on the timeframe selected for the chart.
3 main types of charts
We have 3 main types of charts in MT4: bar, candlestick and line charts. You can choose any of these found on the standard toolbar: mt4_standard_tool_bar.
- To make a bar chart, press the Bar Chart button of the “Charts” toolbar, Alt + 1, the equivalent option of the Charts Setup window, or execute the “Charts – Bar Chart” menu command.
- To make a candlestick chart, press the “Candlesticks” Chart button, Alt + 2, the corresponding option of the Charts Setup window, or execute the “Charts – Candlesticks” menu command.
- To make a line chart, press the Line Chart button, Alt + 3, the corresponding option of the Charts Setup window, or execute the “Charts – Line Chart” menu command.
Staafdiagrammen
An OHLC bar chart consists of a vertical line and two horizontal lines. The upper and lower ends of the vertical line represent the highest (H) and lowest (L) price levels within a given timeframe. The two horizontal lines indicate the opening (O) and closing (C) price levels, respectively. Hence, bar charts are commonly referred to as “OHLC bars.”
Bar charts have different colours depending on whether they are bullish or bearish.
Green is used to indicate bullish or buyer bars, which means that the closing price is higher than the opening price.
Red is used to show bearish or seller bars, which means that the closing price is lower than the opening price.
Candlestick charts
When a box shape is added to the OHLC bars, it transforms into a candlestick bar. Instead of one vertical line and two horizontal lines, the candlestick bar features a rectangular shape, representing the body of the candle. The open and close prices are depicted by the start and end points of the body, respectively, and the colour of the body indicates the direction of the price movement.
When the candlestick’s body is green or hollow (matching the chart background colour), it signifies a bullish candle. Conversely, if the candlestick is red, it indicates a bearish candle.
Additionally, the candlestick typically includes two lines, namely the shadow and the wick. These lines’ upper and lower extensions represent the highest and lowest prices reached within a specific period.
Candlestick bars, also called Japanese bars, derive their name from their origin and the market theory associated with them. Forex traders prefer them as they form patterns that serve as market signals for buying or selling currency trades. Candlestick charts have gained immense popularity due to their ability to effectively condense information when presented.
Line charts
The line chart shows a more simplified version of the price action compared to the bar and candlestick charts. This is because it only displays and connects the closing prices of specific periods.
MT4 chart elements
- Chart timeline
The X-axis, also known as the horizontal axis, is positioned at the bottom of every chart and represents the timeline. It connects different time periods based on the timeframe chosen for market analysis, such as minutes, hours, weeks, or months. The more you go to the left, you can see older periods, whereas the more you move to the right, you can see newer periods.
- Price levels
The Y-axis, situated on the right side of the chart, represents the vertical axis and shows values measured in pips.
Prices increase from the bottom to the top of the chart. An upward trend shows an increase of prices from left to right. A decrease, on the other hand, shows a downward trend.
A sideways or horizontal trend suggests that prices move up or down within a range of prices.
Bid and ask prices
The line in the chart that continually moves is called the price line and shows the current Bid price of a currency pair. If you want to buy a currency pair, you will need to use the Ask price, but if you are selling a currency pair, you will be quoted at the Bid price.
If you right-click a chart and choose Properties, you can see both price lines in MetaTrader 4. Choose the Common tab and tick the Show Ask Line option and then click OK.
The spread is the space between the Ask Line and the Bid Line. Depending on the currency pair and how liquid it is, the spread can vary. This is also the commission your broker will make on each trade.
Tijdsframes
In MetaTrader 4 you can choose between the following timeframes:
- Minutes: 1 (M1), 5 (M5) and 15 (M15) minutes.
- Hours: 1 (H1) and 4 (H4) hours.
- Daily: D1
- Weekly: W1
- Monthly: Mn
To change the timeframe of a chart, click the mt4_tb_charts_period_button on the MT4 standard toolbox. Or, you can right-click the chart and choose the period you want to be displayed.
Trading analysis
Before you place a trade, you can use charts with various timeframes to enhance your market analysis and gain a more comprehensive view of the overall trend in a particular currency pair.
Customisation of charts
You can save time in your trading analysis by creating your own chart templates. To customise your charts in MT4, right-click your chart and click on properties. You can then adjust chart elements. To save your chart template, right-click the chart, choose the Save Template option, name it and click Save.
If you’re just starting with forex trading, IronFX provides a comprehensive library of educational resources to help you trade forex on MT4. Head over to our Website and check our IronFX school or Blog to gain access to free forex courses, eBooks, webinars, and expert analysis for free.
Disclaimer:
This information is not considered investment advice or an investment recommendation, but instead a marketing communication. IronFX is not responsible for any data or information provided by third parties referenced or hyperlinked, in this communication.


