
The ascent of oil prices was interrupted yesterday as Fitch downgraded the US yet we still see the oil market being supported on a fundamental level. In this report, we aim to shed light on the factors driving WTI’s price, assess its future outlook and conclude with a technical analysis.
The US oil market
We make a start with the latest data concerning the US oil market. Beginning with the weekly API crude oil inventories figure which showed a substantial drawdown of -15.4 million barrels in a first sign that the supply side of the commodity was not even near satisfying oil demand in the past week. It should be noted that the tightness of the US oil market was reaffirmed also be the release of the EIA (the Agency) crude oil inventories figure which practically showed the widest drawdown of US oil inventories, at -17.049 million barrels, while the Agency was cited reporting an increase of exports, topping 5 million barrels per day (bpd). Overall the tightness of the US oil market seems to be undisputed for the time being and could have a bullish effect on oil prices should it remain so in the coming week as well.
Fitch downgrading the US
Yet oil prices tended to be on the retreat on Wednesday and it seems that the downgrading of the US by Fitch may have been a major issue. The credit rating agency stripped the US from its perfect AAA rating and downgraded it to AA+. The main reason cited for the decision was the expectation of a difficult fiscal expansion ahead as the US Government, due to the high US debt and debt ceiling rules after the agreement reached with Congress were raising some degree of uncertainty.
The US Government strongly disagreed with the rating agency’s decision and stated that the decision to downgrade the US “defies reality to downgrade the United States at a moment when President Biden has delivered the strongest recovery of any major economy in the world,“.
It should be noted that Fitch is the second credit rating agency downgrading the US after Standard & Poor’s for the same reason. The news tended to raise US Bond yields and cause the USD to wobble, yet for the time being we expect the overall effect to be temporary.
Overall, the US financial data and a number of economists citing the downgrade as out of place tended to out-trump Fitch’s decision allowing for confidence in the recovery of the US economy to remain present. In the big picture oil traders should keep an eye on the issue as, should it blow out of proportion, we may see it continue to weigh on oil prices, while should the overall effect prove to be temporary and the market sentiment improving further, we may see oil prices recovering.
OPEC’s meeting
We conclude with a small comment regarding OPEC’s meeting tomorrow, Friday. The oil production cartel is expected to review its production policy yet no change is expected in OPEC+’s low production levels. It was characteristic that member states view the production cuts announcement as effective, given the rise of oil prices over the past one month. Current WTI prices seem to be in line with the Saudi Kingdom’s expectations for a balanced market. Furthermore, Saudi Arabia seems willing to extend its voluntary production cuts to include September as well. Hence we would expect the Oil production organization to extend its low production levels which may have a bullish effect on oil prices. We should note that the reduction of oil inventories on a global level tends to amplify the bullish effect on oil prices.
TECHNISCHE ANALYSE
WTI Cash 4H Chart
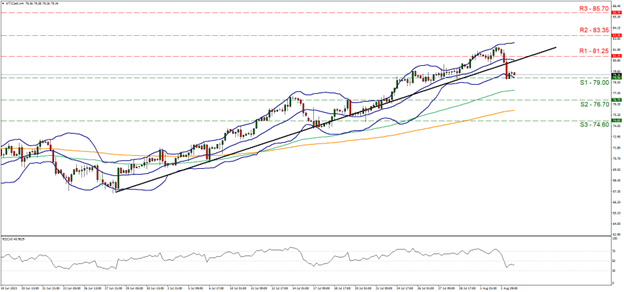
- Support: 79.00 (S1), 76.70 (S2), 74.60 (S3)
- Resistance: 81.25 (R1), 83.35 (R2), 86.70 (R3)
WTI’s price dropped yesterday breaking the 81.25 (R1) support line, now turned to resistance and continued lower to test the 79.00 (S1) support level. Given that the commodity’s price in its downward movement broke the upward trendline incepted on the 28th of June, we temporarily switch our bullish outlook in favour of a sideways motion bias. Please note that both the 100 (Green line) and the 200 (Orange line) moving averages continue to point upwards implying a continuation of the upward movement, yet the more sensitive 20 moving average (blue line) also serves as the median of the Bollinger bands, has already started to bend downwards.
Should the selling interest be renewed we may see WTI’s price breaking the 79.00 (S1) support line and aim for the 76.70 (S2) support level and note as the ultimate target for WTI’s price the 74.60 (S3) support hurdle. Should buyers be in control of WTI’s price we may see it reversing the losses made yesterday, breaking the 81.25 (R1) resistance line and aiming for the 83.35 (R2) resistance base, while should WTI’s price rally we may see the bull’s effort reaching the 86.70 (R3) resistance barrier.
Disclaimer:
This information is not considered investment advice or an investment recommendation, but instead a marketing communication. IronFX is not responsible for any data or information provided by third parties referenced or hyperlinked, in this communication.


