
US stock markets tended to send out mixed signals since our last report as Nasdaq and S&P 500 remained relatively stable while Dow Jones took a dive implying bearish tendencies. In today’s report we are to discuss fundamental issues regarding US stock market but also have a look at NVIDIA and conclude the report with a technical analysis of S&P 500’s daily chart.
Inflationary pressures in the US economy intensify
The release of the June US CPI rates for June took the markets by surprise, as the rates showed an intensification of inflationary pressures in the US economy, beyond market expectations. The rates accelerated on a headline level to 3.7%yy, exceeding market expectations while on a core level also accelerated yet missed market expectations. The big picture though remains that inflationary pressures in the US economy are intensifying. It seems that Trump’s tariffs are coming into effect, raising prices for consumers which in turn tends to verify the Fed’s narrative and may force the bank to maintain rates high for longer. Today we focus on the release of the US PPI rates for the same month in an effort of further verification of the persistence of inflationary pressures in the US economy this time on a producers’ level, yet its understandable that should inflationary pressures on a producers’ level be substantial and persist over the coming months, manufacturers are expected to roll them over to consumers. Hence the PPI rates provide an idea of the relative “depth” of inflationary pressures in the US economy. Overall, should we see the Fed’s worries for inflationary pressures intensifying and the bank hardening its stance, then a bearish effect could be demonstrated in US equities markets.
NVIDIA’s upward momentum maintained
NVIDIA’s share price jumped yesterday as the company is planning to restart sales of its H20 AI chips to China as reported by Reuters. A possible renewal of NVIDIA’s chip sales to China cancels out the restrictions that had been set on the company lifting its revenue outlook. Yet the issue seems to be deeper as its been reported that the lifting of the ban may be part of a trade deal between the US and China, with the red giant lifting restrictions of rare earth exports to the US. Given also the market’s focus on AI and NVIDIA’s leading role in the sector, we may see NVIDIA’s share price continuing to gain support should the company proceed with exports to China.
Trump’s tariff wars continue
US President Trump continued with his trade wars, threatening to levy a 30% tariff on imports entering US soil from the EU and Mexico, from August 1st onwards. Letters announcing the US intentions were sent on Saturday to the two sides. The US intentions were characterised by the EU and Mexico as unfair and efforts are still being made for a possible solution to the problem yet market hopes for such a scenario may have been weakened. Overall, the markets seem to be less sensitive to US President Trump’s trade wars and despite the issue still being fundamentally important, seems to be generating little movement in US stock markets. Hence, it may take substantial unexpected developments for the markets to react on the issue. In any case, should market worries intensify over the issue we may see US stock markets losing ground, while a possible easing of market worries could turn the market sentiment more risk-oriented thus providing support for the US equities markets.
Earnings reports released and ahead
We make a start with the earnings paragraph today by noting that yesterday JP Morgan, Wells Fargo, Citigroup and Bank of NY Mellon reported better than expected figures both on a revenue and earnings level. The releases tend to highlight the health of the US banking sector sending positive signals for the US economy. We are to get a more complete picture for the sector by the release of the earnings reports of Morgan Stanley and Goldman Sachs later today. We also note today the release of the earnings reports of J&J, while tomorrow we get the earnings reports of Netflix and Pepsi. On Friday we get 3Μ’s earnings report and on Monday, Verizon’s and on Tuesday Coca Cola’s and Philip Morris’s reports.
TECHNISCHE ANALYSE
US500 Daily Chart
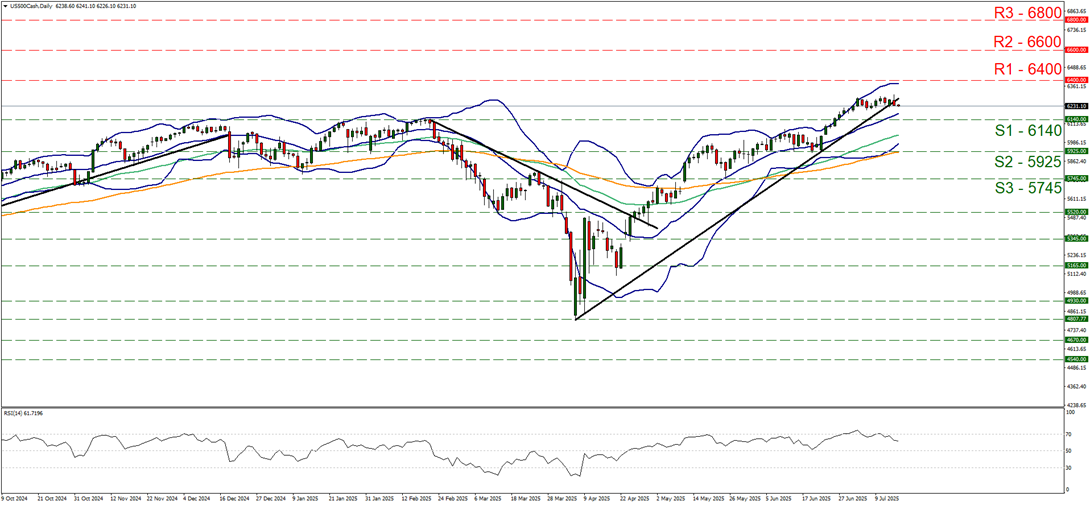
- Support: 6140 (S1), 5925 (S2), 5745 (S3)
- Resistance: 6400 (R1), 6600 (R2), 6800 (R3)
S&P 500 since our last report remained in a relatively tight sideways motion between the 6140 (S1) support line and the 6400 (R1) resistance level. It should be noted that the index’s price action has stabilised near All Time High levels. The index’s price action in its sideways motion broke the upward trendline guiding it since the 7th of April in a signal of an interruption of the upward movement. Hence we switch our bullish outlook in favor of a sideways motion bias for now. Also, the Bollinger bands narrowed, implying less volatility for the index’s price action, On the other hand, we note that the RSI indicator dropped, yet has not reached the reading of 50, which could be implying an easing of the bullish sentiment yet also that it’s still present. Also the 20 MA (blue line), 50 MA (orange line) and 100 MA (green line) are still all pointing upwards implying that a revival of the bullish outlook is still possible, yet moving averages are considered as lagging indicators. For a revival of the bullish outlook we would require the index’s price action to rise and break the 6400 (R1) resistance line, with the next possible target for the bulls being set at the 6600 (R2) resistance level. On the other hand for a bearish outlook to be adopted S&P 500’s price action has to drop, break the 6140 (S1) support line and start actively aiming for the 5925 (S2) support level.
If you have any general queries or comments relating to this article please send an email directly to our Research team at research_team@ironfx.com
Disclaimer:
This information is not considered as investment advice or an investment recommendation, but instead a marketing communication. IronFX is not responsible for any data or information provided by third parties referenced, or hyperlinked, in this communication.


