
Major US stock markets continued to move lower in the current week, as the risk on sentiment in April seems to have disappeared. Despite the ongoing weakness of the indexes the very interesting earnings season seems to excite traders at the moment. Geopolitical tensions are also in the markets focus and seem to eclipse economic developments. In this report, we will highlight the major stock movers in the past days and the fundamentals that follow them.
Alphabet fails to impress with positive results
Alphabet Inc (#GOOG) lost a step on Tuesday leaving behind -3.59% and closed the session trading at $2373. On April 26, 2022 Alphabet Inc. (#GOOG) announced its earnings results for the first quarter of 2022. Most notable was the fact that even though revenues for Q1 2022 increased by 23%, the figure was much lower compared to the revenue increase observed during the same quarter in 2021 (34%). Despite the slowdown in revenues, we must note that YouTube and Google advertising as well as Google Cloud, continued to see growth in revenues and traffic, as some of the most popular products Google uses to engage with consumers. Another positive development from our perspective was Alphabet’s repurchase up to an additional $70.0 billion of its Class A and Class C shares. For the time being, Alphabet’s 52-week price range is between $2193.62 and $3030.93 and its year to date movement is -18.09%. Most market participants focus on Alphabet’s revenue decline even though the company continues to generate significant profits. On the other hand, #GOOG may have followed the general trend to the downside.
Microsoft displays evidence of demand
Microsoft Corp (#MSFT) was also on the backfoot on Tuesday as it lost -3.74% and closed the session at $270.22. On the same day, Microsoft announced earnings results for Q3 2022. Quarterly revenues (GAAP) increased by 18% and reached $49.4 billion. Some of Microsoft’s most distinguished products that continue to contribute greatly to the company’s revenues include Azure and other cloud services, LinkedIn and Dynamics 365. Positive is the fact that according to analyst estimates, Microsoft managed to beat expectations and showed strong demand for several of its products. For the time being, Microsoft’s 52-week price range is between $238.07 and $349.67 and its year to date movement is -19.65%.
Can Elon Musk run Tesla and Twitter simultaneously?
The most significant movement on Tuesday was carried out by Tesla Inc. (#TSLA) that dropped -12.18% performing its largest daily drop in a year. Tesla closed its normal trading session at $876.42. In the past days, Tesla’s CEO, Elon Musk captured major attention with his eagerness to buyout Twitter Inc (#TWTR) in a $44 billion deal. At the moment, (#TSLA) shares are down -17.07% with its 52-week price range being between $546.98 and $1243.49. It is possible that the market perceived Musk’s interest in (#TWTR) as a weakness for (#TSLA). Elon Musk maybe using Tesla’s funds to get a hold of Twitter thus the exaggerated selloff for the latter. However, with Musk’s decisive movement towards Twitter, a field rather unknown to him, we notice his ambitions as an entrepreneur. He has done this various times in the past, once including a trend towards digital currencies. Yet a successful EV manufacturer and seller does not guarantee success in the Social Media platform sector. On Tuesday’s closing Twitter’s 52 week price range was between $31.30 and $73.34, while its year to date movement remains positive at +14.95%.
TECHNISCHE ANALYSE
#TSLA H1
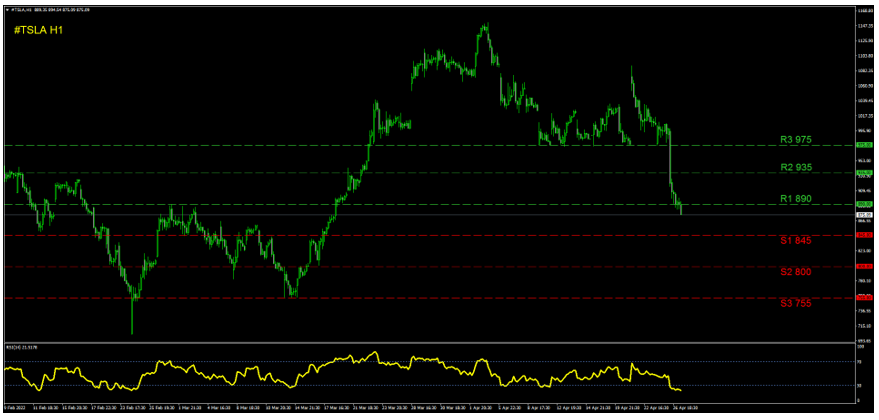
After the recent selloff Tesla’s share has dropped into the price range that was used before the 18th of March, which is below the currently noted (R1) 890 resistance level. If this trend is to continue, a move to the (S1) 845 support level may be imminent. A more intense selling move can force the price action to even lower grounds like the (S2) 800 support level or the (S3) 755 barrier. In the scenario of a rebound upwards, we may see a resurgence towards the (R1) 890 resistance level. The (R1) has been used as a resistance and a support in the past, indicating traders tend to respect it. If the upward trend persists, we may see the price action being pushed towards the (R2) 935 line. On the other hand, for the share price to fully recover and reach ground seen recently we may require a buying move able to top the (R3) 975 line. This would elevate the price action to the price range used previously in April. Currently, the RSI indicator has dropped below the 30-line giving the notion of an oversold position.
If you have any general queries or comments relating to this article please send an email directly to our Research team at research_team@ironfx.com
Disclaimer:
This information is not considered as investment advice or an investment recommendation, but instead a marketing communication. IronFX is not responsible for any data or information provided by third parties referenced, or hyperlinked, in this communication.


