

Gold’s price moved higher since the beginning of the week. Today we are to discuss the fundamental challenges laid ahead for the precious metal, the Israel-Iran tensions, the recent financial releases stemming from the US and the recent inflow’s into Gold ETFs. Finally, we will be concluding this report with a technical analysis of gold’s daily chart.
Israel-Iran tensions take the spotlight once again
Tensions between Israel and Iran remain in the spotlight for another week in a row, with both sides and their allies having moved strategic assets into the region. That being said, we should note that this is the second time this year that we have seen the two nations at blows with one another.
In particular, US Defence Secretary Lloyd Austin ordered on Sunday the deployment of a guided missile submarine to the Middle East, with some media outlets also claiming that the Defence Secretary has ordered the USS Abraham Lincoln aircraft carrier strike group to hasten its pace to the region.
Nonetheless, at this point in time the movement of strategic military assets into the region is mere posturing by both sides, either as a deterrent or in preparation in the event that the situation drastically deteriorates. Hence, with tensions remaining high, it may funnel safe haven inflows into the precious metal and thus aid gold’s price as it is considered to be a hedge during times of uncertainty. However, in the event of a de-escalation, it may weigh on gold’s price.
US economy in focus
The US PPI rates for July which were released earlier on today, came in lower than expected, with the Core PPI on a year-on-year level coming at 2.4% which was lower than the expected rate of 2.7% and the prior rate of 3.0%. Thus, the softer-than-expected inflation in the US producer prices may increase pressure on the Fed to cut interest rates in their September meeting, as cracks begin to appear in the US economy.
However, the next big test for gold traders may be the release of the US CPI rates for July on Wednesday, which are expected to showcase persistent inflationary pressures when looking at the year-on-year rate which is anticipated to remain steady at 3.0%, whilst on a month-on-month basis, the CPI rate for July is expected to accelerate to 0.2% from 0.1%.
Overall, should the CPI rates for July showcase persistent or even an acceleration of inflationary pressures on the US economy, the pressure on the Fed to cut interest rates in September may ease which in turn may aid the dollar and weigh on gold’s price given their inverse relationship with each other.
However, should the CPI rates showcase easing inflationary pressures in the US economy, it may have the opposite effect and thus could potentially weigh on the dollar, whilst providing support for gold’s price.
Gold ETFs showcase an increase in inflows
According to the World Gold Council, global gold ETFs saw one of their strongest months since April 2022, with Gold ETFs attracting $3.7bn in July, marking a third consecutive monthly inflows. The large amount of inflows into Gold ETFs as reported by the WGC may have aided gold’s price and thus should demand for gold continue to increase in the coming months, it may further aid gold’s price. On the flip side, should demand for gold begin to subside it may instead weigh on gold’s price.
Gold Technical Analysis
XAUUSD Daily Chart
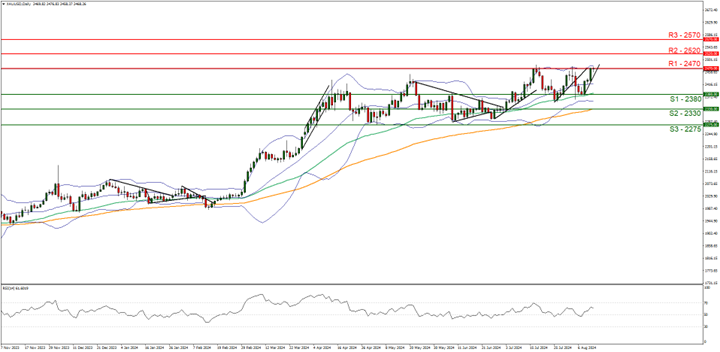
- Support: 2390 (S1), 2330 (S2), 2275 (S3)
- Resistance: 2470 (R1), 2520 (R2), 2570 (R3)
Since our last report gold’s price has taken aim for our 2470 (R1) resistance line, with the commodity’s price currently testing the aforementioned resistance level.
We now opt for a bullish outlook for the precious metal and supporting our case is the RSI indicator below our chart currently registers a figure near 60, implying a bullish market sentiment, in addition to the upwards moving trendline which was incepted on the 8th of August. For our bullish outlook to continue, we would require a break above the 2470 (R1) resistance line with the next possible target for the bulls potentially being the 2520 (R2) resistance level.
On the flip side for a sideways bias, we would require the commodity to remain confined between the 2380 (S1) support level and the 2470 (R1) resistance line. Lastly, for a bearish outlook we would require the precious metal’s price to clearly break below the 2380 (S1) support line with the next possible target for the bears being the 2330 (S2) support level.
Disclaimer:
This information is not considered investment advice or an investment recommendation, but instead a marketing communication. IronFX is not responsible for any data or information provided by third parties referenced or hyperlinked in this communication.


